Coordinate Graphing Worksheets
Coordinate graphing has several different uses. They can be used to track physical locations to modelling potential or physical situations that can be explained with math. The overall goal of coordinate graphs is to show relationships and relative magnitudes of different values. They are great for tracking positions and changes in position. They are used often in algebra to model expressions and equations. The change in coordinates is often used to make forecasts for businesses and organization. Over the years this has become a critical skill that many employers are looking to hire for. These worksheets and lessons will help students learn to master the ins and outs of coordinate graphing and how it can be applied to other situations.
Aligned Standard: Grade 6 Numbers - 6.NS.C.6c
- Estimate Numbers Line Step-by-step Lesson- Find the value of an marked point on a numbers line by inferring the value.
- Guided Lesson - Find all these random objects on the coordinate grid. State their position for us.
- Guided Lesson Explanation - I explained it as simply as I could. I use visuals on previous grade levels, so I figured I would talk them through it at this grade level.
- Practice Worksheet - Lots and lots of practice for you to work with. Use the legend to find out what you are looking for.
- Matching Worksheet - Find quadrants, positions, and inverted coordinates in this set.
- Draw Shapes on the Grid 5-Pack - Draw the x, y position of where each shape belongs.
- Coordinate Graphing 5-Pack - Plot more points for us. This will result in ten different plots over five pages.
- Identifying Location on a Grid 5-Pack - What points are these objects at? Just state them.
- Locate Ordered Pairs 5-Pack - Find the areas that these things belong in.
- Draw the Position 5-Pack - Where does it go? You will draw shapes that are requested of you at each of the points that you are asked to.
- Writing Coordinates 5-Pack - Find the coordinates of all the point on these sheets.
- Draw the Position Second 5-Pack - Where do we find everything?
- Determine Grid Location 5-Pack - Name the position it is at.
- Identifying where things are on a grid-X, Y Position 5-Pack - A great review pack for you.
- Answer Keys - These are for all the unlocked materials above.
Homework Sheets
See if this neat progression of worksheets works for you. I find this to be very helpful.
- Homework 1 - Find the value of f. Write your answer as a decimal number.
- Homework 2 - What is at (2,2)? You will plot how to get there step by step.
- Homework 3 - Find the value of w. Write your answer as a whole number.
Practice Worksheets
The decimal numbers lines stump many, at first.
- Practice 1 - What is at (3,-3)? Name what is at point on there.
- Practice 2 - Find the value of h. Write your answer as a whole number.
- Practice 3 - Where is the Telescope? Label the points for us.
Math Skill Quizzes
We focus on locating items on the coordinate grid most.
- Quiz 1 - Get it all out there. You will be given a number line and variable positioned on it. Describe the position of the variable.
- Quiz 2 - Which of the three objects is the point located at the indicated points.
- Quiz 3 - You may estimate to get it started. This is a real mix of skills.
How to Find the Value (position) of Points on a Coordinate Graph
For some students, coordinate graphing might sound a bit too dramatic, but in reality, it is a visual method for showing a relationship between numbers. The relationship is shown in a coordinate grid which has two perpendicular lines, or axes. The vertical axis is called the y-axis, and the horizontal axis is known as the x-axis. In order to find a location, position or point on the graph, a coordinate grid is used. Each point is located on the grid by an ordered pair, an x-axis, and the y-axis. Every grid has an origin that is located at the point (0,0). Take look at how all these positions unfold on the coordinate grid below:
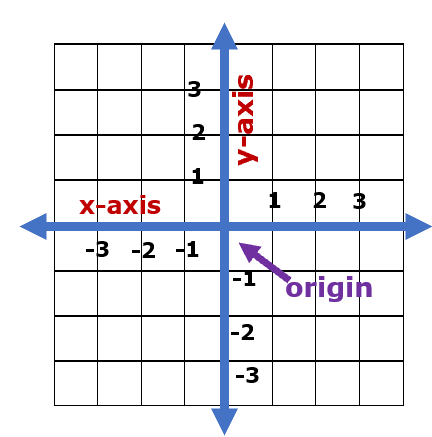
Positive values go to the right of the origin and negative x values go to the left of the origin. Positive y coordinate values go up and negative x values go down. When you look at x coordinate values, they go from left to right. What if the coordinates that were provided are (2,5), this means that the point lies on point 2 on the x-axis (right from origin) and 5 on the y-axis (up from origin). So that is 2 to the right and 5 up. It is very important to understand the order in which the coordinates are written in an ordered pair. The x-coordinate always comes at first, and the y-coordinate follows it in (x, y) fashion.
How Does the Coordinate Plane Related to Real Life?
There are so many applications of the coordinate plane in the real world that there are too many to list. They can be used in a practical sense to navigate things like two-dimensional maps and positional charts. These positional maps were made popular by explorers of the world, but in today’s satellite driven world, the Global Positioning System (GPS) can have a high level of accuracy up to three meters. Depending on where you are located on the planet, that level of accuracy can change. It is all dependent on your line of sight to the satellite. Coordinate planes can also be used abstractly to model spatial coordinates. You will find this commonly used by physicists and chemists to predict the movement of particles found within an atom. In most case, they we add the condition of the z-axis which allows this to be elevated to a three dimensional map.