Linear Equation Worksheets
Linear equations describe the position of a straight line on a graph. They are used as an important mathematical tool by scientists to help them better understand the relationship between two variables in the physical world. They can help you make much more accurate forecasts, spot trends, and stimulate the creation of accurate predictions. The national curriculum is really getting big into this area. There are many other linear equations, and you can deal with them while you are doing algebraic questions. It’s essential to learn the concept at the primary level so that you can deal with non-linear equations. These worksheets and lessons will be very helpful to improve your ability with this level of math. You will see more of these added every week.
- Analyzing Functional Relationships by Graphing - This can help us see trends and understand relationships between the data.
- Comparing Properties of Two Functions - You can approach these a number of different ways.
- Equation of a Straight Line - We learn the concept of slope and y-intercept.
- Finding Where Lines Intersect - The one time their equations are equal.
- Functions as Inputs and Outputs - See what you put in and how it comes out.
- Graphing Linear Equations - We learn how to spot trends in data and what it means towards the concept of a relationship.
- Linear Equations as a Matrix Equation - We learn how to expand linear equations here.
- Linear Equations in One Variable - The is the basic level you will start with.
- Linear Function Word Problems - These come in a wide variety of problems.
- Point and Slope - We can use these to figure out the equation of a line.
- Solving Systems of Equations - You start by setting them equal to one another.
- Understanding the y-Intercept - This is just where the line hits the y-axis.
- Using Functions to Model a Linear Relationship - You will be modelling data through the use of equation creation.
- Using Straight Lines to Model Relationships - This can be quite challenging at first.
What is a Linear Equation?
A linear equation is a specific type of equation where the highest power is 1, and it has a maximum of two variables. It shows the dependency of one variable (such as x or y) and how its change of value can affect the other variable. They normally contain constants like a number, or the c. Variables found within linear equations do not have exponents, square roots, or cube roots. You must also keep in mind that a linear equation on a graph makes a straight line.
Linear equations are most common written in what is referred to as Slope-Intercept Form. Which follows the backbone model of y = mx + b. The variables (x, y) are the positions of ordered pairs on a coordinate graph. They are commonly what we are chasing. The value m in this form represents the slope of the line. Slope is an indicator of the steepness of the line. This is calculated by dividing the change in height (y) by the change in horizontal distance (x). The value b is called the y-intercept and tells us where the line of this equation would pass across the y-axis when graphed.
The other less common method for expressing linear equation is called Point-Slope form. I find this form best to describe lines that we know a good deal about. This form is modelled by the equation y - y1 = m(x - x1). This requires you to know at least a single point on the line. Once you know that point you take the ordered pair and plug them in as (x1 and y1). The variable m still represents the slope or steepness of the line.
How Do You Graph a Linear Equation?
The great thing about graphing linear equations is that they represent straight lines which means we only need to know two points on the graph to create these lines. Once you have located those point, connect them with a straight line and you can continue to extend the lines to the edge of the graph. Another quick trick is to find the two points by setting the variables x and y equation to zero allows for some easy math to find the other variable. Let’s put this to work and graph the linear equation below.
Graph: y = 3x - 4
Step 1) We start by setting both x and then y equal to zero and see the location of each ordered pair that it creates.
a) x = 0 would create the equation y = 3(0) - 4. This would result in y = -4. So our first ordered pair is (0 , -4).
b) y = 0 would create the equation 0 = 3x - 4. We would need to rearrange this to solve for x: 4 = 3x. This would result in x = 4/3 or 1 1/3. So our second ordered pair is (1 1/3 , 0).
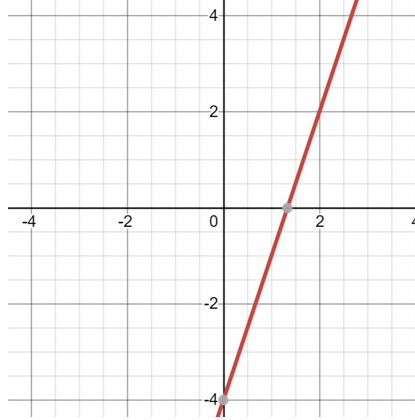
Step 2) We would then plot both ordered pairs (0, -4) and (1 1/3, 0) on a coordinate graph. Then connect the points with a straight edge and extend it to infinity as you will see below.