y Intercept Worksheets
When you begin to understand the dynamics of either a single or a series of equations and/or functions it is helpful to look at the trends that can be used to portray them on a graph. A graph of the data that is visualized can increase our ability to retain the value of what is being lite upon within this series of a data set. One of the most fundamental positions on these graphs is called the y-intercept. This is where everything begins, as a result the x coordinate is equal to zero. This means that this where the line that is formed crosses that y-axis. When the equation of a line is displayed in slope-intercept form, which can be stated in the form of y = mx + b, the y-intercept is stated as the variable b. The best way to convey this value to students is to display different types of situations and explain the meaning of the variable b within the equation. This is where we can explain the start and ultimately the finishing points of trends within the data that we have for all the information that we acknowledge for any data set. On this page you will find a selection of both worksheets, lessons, and other teaching materials that can be used to replicate where a value may cross one of these graphs to indicate a value equal to x as a zero.
Aligned Standard: Grade 8 Functions - 8.F.B.4
- Danny's Cab Situation Step-by-Step Lesson- We ask you to write an expression for a mathematical scenario.
- Guided Lesson - These are word problems at the next level of thinking that students will appreciate.
- Guided Lesson Explanation - There are a number of ways to solve these types of problems. I share the most simplified forms with you.
- Independent Practice - More equation based word problems for you to walk through.
- Matching Worksheet - Match the problems to their equation based solution.
- Answer Keys - These are for all the unlocked materials above.
Homework Sheets
Writing expressions is a prerequisite for this topic.
- Homework 1 - Kelly has to deposit $245 to rent a room and $5 per day charge for a cleaner. Write an expression to calculate the total rent shown by F and number of days by B.
- Homework 2 - At a bakery Harry eats 8 sticky buns in two hours. If he continues at this rate, how many will he eat in 6 hours?
- Homework 3 - Smith is a chip sales person. He gets $50 monthly and $3 per pack of chips sold. Write an equation to show his income.
Practice Worksheets
My granddaughter demanded a dancer question in here. You can thank her for sheet 1.
- Practice 1 - John has an ice cream shop. John sold 15 ice creams in one day. If he continues at this rate, how many ice creams will he sell in 6 days?
- Practice 2 - One day Johnny eats 10 burgers in 5 hours. On the second day he eats 12 burgers in 6 hours. How many burgers does Johnny eat in an hour?
- Practice 3 - Fred eats 10 candies every day. Write an equation that shows the relationship between the number of days (x) and the total number of candies (y).
Math Skill Quizzes
These quizzes can take some time for students to complete.
- Quiz 1 - Rachel eats 4 mangoes in one hour. Write an equation that shows the relationship between the number of hours (n) and the total number of mangoes (m).
- Quiz 2 - John sold 50 candies in one day. If he continues at this rate, how many candies will he sell in 12 days? Solve an equation to find the answer.
- Quiz 3 - Shelly works in a stationery shop. She sold $40 of stationary over 8 hours. Then, next day, she sold $45 worth over 9 hours. How much money did she earn each hour?
What is a y-Intercept?
When discussing straight lines, each and every component of the equation is discussed in detail. In the equation of a straight line, which is y = mx + b; there are 3 different components combined in one equation. One component denotes the slope, one is a variable value and the last component is the y-intercept. Here, m is the slope multiplied by x and b is the y-intercept.
But does this little definition of y-intercept make it clear to you that what is y-intercept? If not, then it is the time to understand the theoretical definition of y-intercept in order to identify it the next time in an equation. In the context of word problems, the y-intercept also refers to the starting value because the x is at zero. This is the point where you start taking the values.
When you plot a linear equation on a graph, it is the point where the linear graph crosses the y-axis. At this point in the graph, the y-intercept is the point (x, y) with x = 0. The y-intercept is calculated by keeping the value of x equals to zero.
The y-Intercept on a Graph
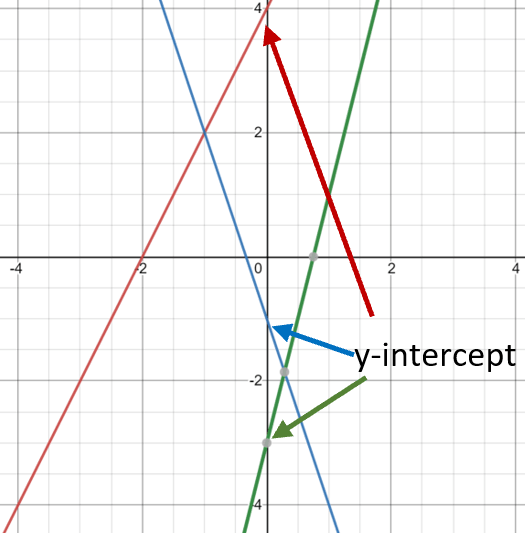
Take a look at the y-intercepts, on the graph to the right, of three different lines.
The red line is a visualization of the equation y = 2x + 4. As we can see, by the red arrow, the line breaks the y-axis at the point (y = 4).
The blue line is the graph of the equation y = -3x - 1. As we can see by the graph and the line the y-intercept for that equation is -1.
The green line is for the equation: y = 4x - 3. Can you guess the y-intercept from the equation or graph? Did you guess it was -3? You would be right in that case.