Graphing Linear Equations Worksheets
A linear equation is just a fancy way of say an equation for a straight line. In science they serve a particularly important purpose and are one of the foundational tools that scientists use to describe and identify relationships between two variables somewhere in the physical world. Once a relationship is identified it can be used to make accurate predictions of future interacts of those variables. This helps the scientific community explore the world and the complexity of the universe. These types of relationships are fairly common and can easily be gauged using a simple graph. There are positive relationships between variables that results from the line graph increasing (rises) from left to right. This means as one rises, so does the other. As you would think, negative relationships are ordinary too. They are sometimes referred to as inverse relationships and the line steadily falls on the graph, in this case. This selection of lessons and worksheets will help you understand an equation in linear form. They will review the concept of slope and intercepts.
Aligned Standard: HSA-CED.A.2
- Simple Equations Step-by-step Lesson- You are given an equation and we walk you through all the steps to bring it to life on a graph.
- Guided Lesson - We learn how to sketch lines, find the slope, and where it crosses the y-axis.
- Guided Lesson Explanation - We explain everything you need to know for this skill. This is three pages in all.
- Practice Worksheet 1 - You bring to life three instances of this on a single graph. A nice way to visualize how everything relates.
- Independent Practice 2 - You are only given the slope and the y-intercept and asked to pull everything out from that. A more advanced approach to this skill.
- Answer Keys - These are for all the unlocked materials above.
Homework Sheets
We hit this skill from every different angle. It really shows you the power of only having a small amount of information.
- Homework 1 - You will sketch six lines.
- Homework 2 - You will really break down the slope-intercept form.
- Homework 3 - Put all your math skills to work here. You will need to decide on fixed points of your own to work off of.
Practice Worksheets
As you pass over all these sheets, you should have a decent understanding of the nature of these types of exercises.
- Practice 1 - Do not get lost in all of threes and fours in here.
- Practice 2 - We introduce a few more fractions for you to work with.
- Practice 3 - You are given ordered pairs to determine the lines that they would create.
Math Skill Quizzes
The mastery of skill increases with each successive quiz. Yes, ironically there is a linear relationship behind this approach.
- Quiz 1 - Once you create the lines, go back and make sure it fits the slope and intercepts properly.
- Quiz 2 - You can pretty much choose any points to work off of from the lines. The more spread out that they are, the more accurate the line will be.
- Quiz 3 - The ordered pairs quiz that puts it all together for you.
How Do You Graph These Guys?
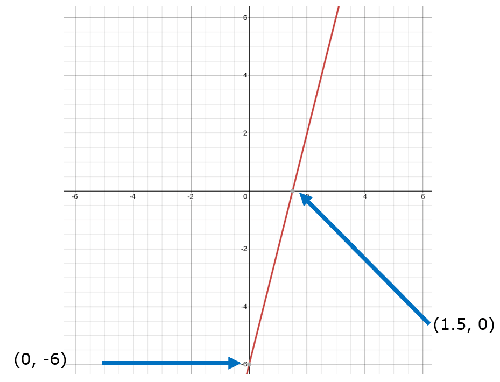
You are given the linear equation: y = 4x – 6 and asked to plot the line on a graph.
Logic: If you want to creep in on the numbers that are involved within a linear equation, you can graph it by finding any two solutions such as (x1, y1) and (x2, y2) and just plot them on a graph, so why don’t we do that? To set this up so we could do it, just set the opposite variable to zero to solve for the other variable. We could proceed with x or y as 0, but why not start with x since it alphabetically comes first?
Step 1: Set x to 0 in the equation.
y = 4(0) – 6
y = -6
Step 2: Set y to 0 in the same equation.
0 = 4x – 6
6 = 4x
6/4 = x
1.5 = x
Step 3: Review what we know already based on our first two steps.
Reviewing step 1, we know one point on the line is (0, -6).
Reviewing step 2, we know another point on the line is (1.5, 0).
Step 4: Plot the two points and connect them by drawing a line.
What Is a Linear Equation?
An equation with the highest degree of 1 is known as a linear equation. In other words, linear equations are first-order equations. Moreover, no equation with a variable of more than one degree can be considered linear.
If we talk about the coordinate system, linear equations are determined by lines. Moreover, there can be one or more variables in a linear equation. If the linear equation has one variable, we call it a linear equation in one variable. Similarly, if there are two variables in a linear equation, we name it a linear equation in two variables. There are three forms of linear equations; Standard, Slope-Intercept, and Point Slope.
Let's understand their mathematical representation in the standard form. The linear equation in one variable is represented as Ax + B = 0. In this equation, A and B are constant whereas, x represents a variable. On the other hand, a linear equation in two variables is represented as Ax + By = C. Here, A, B, and C are constants, whereas x and y represent variables.
Geometry and algebra are the two disciplines that use linear equations daily. With linear equations, the graph consists of lines and slopes. Additionally, they can also describe how one variable is dependent on another. For example, you might have a line that tracks the sales of a product vs. the advertisement budget of the company. They are used in various applications, such as in manufacturing and economics.
Why Do We Need to Graph Linear Equations?

The graph of a linear equation helps depict the relationship between quantities that vary at a constant rate. Moreover, they are more efficient than equations.
The graph of a linear equation is always a straight line. If we talk about a linear equation graph in one variable, then with variable x, it will form a vertical line parallel to the y-axis. Whereas with a variable y, it will form a horizontal line parallel to x. However, the graph of a linear equation with two variables is a straight line.
Every linear equation in a variable has a distinct solution. Likewise, if we talk about a linear equation in two variables, the solution will consist of a pair of values of x and y that satisfy the equation. Let's consider an example to understand better.
The equation x + 4y = 0 is a two-variable linear equation. Consider three points of x; 0, 4, and 8. For each value of x we will get a corresponding value of y. If we take x = 0 then y will also be 0, hence, (0, 0) is a possible solution. When x = 4, y will be -1 and the solution will be (4, -1). Similarly, when x = 8, y = -2, the solution will be (8, -2).
If we connect these points in a cartesian coordinate (x-y coordinates), the result will be a straight line. Moreover, the equation will be true for each point. Therefore, a linear equation in two variables can have numerous or infinite solutions.
With the advancement in technology, we observe a lot of change, where each quantity is influenced by a change in another quantity. A simple example of that can be the income generated by a restaurant. If the number of people visiting the restaurant increases, so does the income and vice versa.
In some cases, there will be an increase or decrease in one quantity with the increase or decrease in another quantity. This change is called direct proportion. On the other hand, if a quantity decreases with an increase in another quantity or vice versa, we call it indirect proportion. To understand the relation between these two quantities, we graph linear equations.
When performing calculations in daily life, it's important to have a basic understanding of how to use graphs. The graphs are not just limited to math students; they can be helpful in every walk of life, depending on your needs.
The Application of Linear Equation Graphs
As we know, linear equations use one or more variables, and these variables depend on one another. A linear equation graph can be used to depict quantities involving an unknown number, such as predicting profits and estimating income and distance over time, budgeting, and variable costs. Let's see an example.
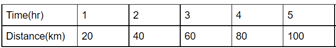
Example: A person can drive a two-wheeler constantly at a 40 km/hour speed. Construct a distance-time graph. Find the (a) time taken by the person to ride 100 km and (b) the total distance covered in 3 hours.
Solution: To solve this problem, we first need to make a table that represents the distance traveled and time taken by the person to cover 100 km.
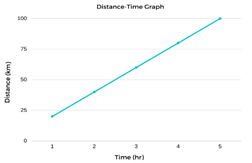
Now that we have all the values, we can construct a time-distance graph with the help of the above table.
We can calculate our results using the graph. The y-coordinate of the graph shows 100 km at an x-coordinate of 5 hours, and it takes 5 hours to travel 100 kilometers. Similarly, the x-coordinate of the graph indicates 3 hours at a y-coordinate of 60 km. Therefore, the distance covered by the person in 3 hours is 60 km.