Distance on a Coordinate Plane Worksheets
In the 17th century Descartes developed the coordinate plane and it allowed mathematicians to describe and track algebraic relationships visually. Over time it was interesting how this grid system could overlay a map and help us understand position and changes in them. By attributing an ordered pair to designate a standing point for an object you could create a strategy to manipulate the pieces within that system. Whether it was for an actual game or just determining a way to more efficiently stack boxes in a warehouse. These worksheets and lesson will help students learn how to calculate distance using the coordinate plane as a guide.
Aligned Standard: Grade 6 Numbers - 6.NS.C.8
- Map Distances Step-by-step Lesson- My Google places on my phone is really just a big coordinate graph?
- Guided Lesson - Find the distance between objects on a coordinate system.
- Guided Lesson Explanation - Sorry, this one is all explained with writing. Older kids should be able to follow it with ease.
- Practice Worksheet - Man, those graphs take up space. This work is spread over 4 pages.
- Matching Worksheet - This one took me some time to set up properly.
- Answer Keys - These are for all the unlocked materials above.
Homework Sheets
Start with simple point plotting. The last two sheets focus on distance between points of interest.
- Homework 1 - Find the distance between (5, 4) and (5, 7).
- Homework 2 - How many blocks is the Dog from the Camel?
- Homework 3 - Find the distance between (3, 3) and (3, 7).
Practice Worksheets
You might want to start with worksheet 2 here and then back track to number 1.
- Practice 1 - How far is the Pineapple from the Chocolate milk?
- Practice 2 - Find the distance that exists between various points.
- Practice 3 - How far is the Cricket from the Donkey?
Math Skill Quizzes
1 and 2 are slightly different skills and then 3 covers both of them.
- Quiz 1 - How far is the Tortoise from the Bee?
- Quiz 2 - The gross distance between two points.
- Quiz 3 - How many blocks are the muffins from the pineapple?
How Do You Track Distance Between Objects on a Coordinate Plane?
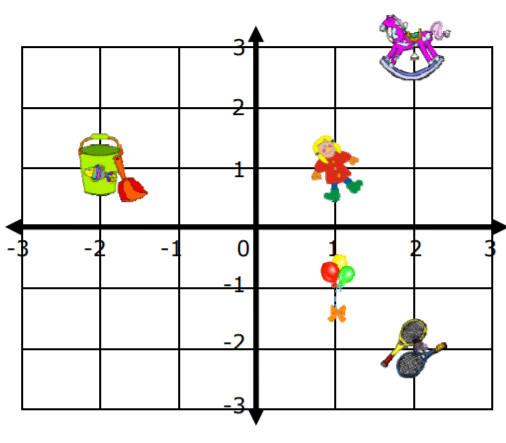
It all depends on where the objects are positioned relative to one another. There are some positions that are considered slides either in a vertical or horizontal direction. If you look at the doll in the diagram it is at position (1,1). It is horizontally relative to the pail which is located at (-2, 1). As we can see they share the same y position, but the difference in their x position can be defined as 3 because they are 3 positions on the grid away from one another. Do not let negative numbers throw you, distance is an absolute value. There is a similar directional position between the doll and the balloons, but it is a vertical difference. This means that they share the same x-position but differ at the y-position. We can calculate that difference much in the same way and the difference between (1, 1) and (1, -1) is 2 at the y-position.
There are also instances on this coordinate plane where we have objects positioned diagonally from one another. If we stick with the doll (1, 1), we can see that the rocking horse is a perfect diagonal from it at position (2, 3). We can use what is called the distance formula to find this difference in distance. It relies on the Pythagorean Theorem because if you look at the image below you will see that the two objects are basically a right triangle away from one another:
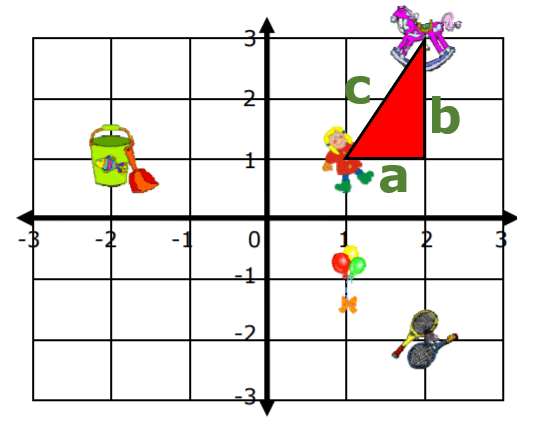
The Pythagorean Theorem tells us that a2 + b2 = c2. As you can see from the diagram, we can easily calculate side a and side b. Side a goes from (1, 1) to (2,1) which gives us a side difference of 1. Side b goes from (2, 1) to (2,3) which gives us a side difference of 2. Side c is undefined, but we can calculate this as side a2 + side b2 = side c2. If we put our values in, it would look like: 12 + 22 = side c2 = 1 + 4 = side c2 or side c = √5 or 2.24.
How Are Graphs Used to Solve Real-World Problems?
The majority of the students, while solving graphical equations, have one very important question, and that is, how coordinate graphing can help in real-world problems? There are several implications in life where the two sets of numbers can be used for indicating depending and independent variables.
For example, if you are given the price of one ticket for a particular show, you can easily calculate the cost of all the people that are going to attend the event. Similarly, if you are familiar with how much one gallon of gas costs, you can easily calculate how many gallons you can buy with the money you have.
One of the most difficult things is to keep track of the data and keeping it in an organized manner. This issue can be solved by using a function table. A function table usually has two columns, and it can show the relationship between two strings of numbers. One string is based on the values on the x-axis, and the other one is one the y-axis.
The coordinate plane lends itself directly to maps and geography. Do you remember the family game Battleship? The system is very similar and can be used to manipulate just about anything on a real time map. How far apart or close are things on a map. How much distance will it take to reach various structure? These are all things that can be answered through simple geometry on a coordinate plane. When you think about it that is all that GPS is covered across the entire global map.