Graphing Inequalities on a Number Line Worksheets
Inequalities state the mathematical relationship between two values that are different. In the real world we use inequalities to describe situations where we are looking for a solution. They are often used to form hypothesis and develop experiments whether they happen in a science lab or in a large business or organization. They are great for helping us track changes and from that data we can make more knowledgeable decisions. We will often plot these inequalities on a number line to get a better understanding of their nature and how they behave. In this section of worksheets and lessons we will first teach you how to read and interpret these visuals and also teach you how to graph an inequality on a number line.
Aligned Standard: Grade 6 Numbers - 6.NS.C.7a
- Numbers Line Inequality Step-by-step Lesson- Write what is shown on the number line as an inequality.
- Guided Lesson - Just remind them to look for the open or closed circle first. Then observe the direction of the line.
- Guided Lesson Explanation - I feel that this is explained well. If you don't think so, let me know how to improve it!
- Practice Worksheet - It is an onslaught of number lines to inequality problems for you to have fun with.
- Matching Worksheet - Use the numbers lines and match them to the inequality that they represent.
- Answer Keys - These are for all the unlocked materials above.
Homework Sheets
The open and closed bubble is what gives most kids trouble.
- Homework 1 - What inequality does this number line show?
- Homework 2 - A filled-in circle includes the number it is located on. An open circle does not include the number it is located on.
- Homework 3 - We want to write an inequality that says x can be anything shown by the arrow and circle.
Practice Worksheets
This skill gives many students great difficulty.
- Practice 1 - A filled-in circle includes the number it is located on. An open circle does not include the number it is located on.
- Practice 2 - The arrow pointing to the right means that x can also be any number greater than or equal to the value indicated.
- Practice 3 - What inequality does this number line show?
Math Skill Quizzes
Once students have no trouble writing an inequality from a numbers line, they are good to go on this skill.
- Quiz 1 - Explain each number line as an inequality.
- Quiz 2 - You will explain what you see in a numeric expression.
- Quiz 3 - More practice to see if you have this skill down.
How to Write Inequalities on Number Lines
Number lines serve as a great tool to visualize values and give the viewer a relative understanding about the significance of that value relative to what surrounds it. Previously we have learned to write all types of different rational numbers on a number line. We now are looking to draw inequalities on them, which is very similar, but it simply is not exact. That is the nature of inequalities they are not exact answers only rough estimates of where the answer falls in. For instance, if you were asked where a friend was in your school. With specific numeric values, we would say your friend is in room 204. An inequality stated of where you friend is will not give away his exact position but give you a good idea of where he is. It may be the equivalent of saying that your friend is in one of the rooms in that hallway.
When we begin to learn to state inequalities on a number line it is much like stating exact values, there is just two little differences. We start by locating the position of definitely stated value, just like fixed values. Here is where the differences kick in, inequalities come in two forms: a) different (less or greater) and b) different (less or greater) or equal. If the expression has a greater than (>) or less than (<) symbol, the point is indicated on the number line as an open circle. If the expression has a greater than and/or equal (≥) or less than and/or equal (≤) symbol, the point is indicated on the number line as a closed or filled circle. The last difference is that from that point we draw an extended line to indicate the direction of the greater or less than sign. The less than symbol points the arrow in a direction that is left across the entirety of the number line. The greater than symbol point the arrow in a direction that is right across the entirety of the number line.
Suppose you are starting to take care of your health, and you have decided to reduce your calorie intake. So, let us suppose that the number of calories I am allowed to eat on a given day is represented by the letter C.
C = number of calories
And we want to lose some weight so. We want to consume less than 1,500 calories a day. So how can this be expressed as an inequality? We can write this as: C < 1,500.
On some days when we workout hard, we want to take in our minimum number of calories, so we have some energy. If we want to include 1500 in the mix as well and not just the values that are less than 1500, then we write: C ≤ 1,500
If we want to write an inequality on a numbers line. Suppose we are plotting A > 4, then the plot on the numbers line would be an open circle with an arrow pointing the right of 4 and extending to the end of the line. Plotting this on a number line would look like this:
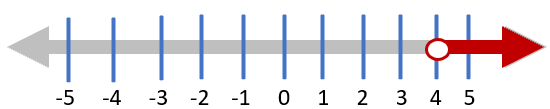
Note a few things about the line we plotted: a) Since the inequality was stated as greater than, the circle is open (not filled) at the position of 4. B) The greater than 4 is expressed by pushing the arrow to the end of line in the positive direction (right).
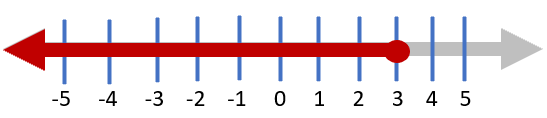
Suppose If we are going for A ≤ 3. The plot on the number line is placed at the 3 position and it would be a closed circle because the value is stated as ≤ . The arrow would pointing to the end of the number line to the left to express the less than value. Pay attention that when we don't include the limit we defined, it is denoted by an open circle but, when adding the limit in the list of values, it is a filled circle. It would look like this:
Why Do We Graph Inequalities on a Number Line?
We first must understand what an inequality truly is to understand why we do this. Inequalities are equations that just are not equal or are lopsided. They state can start that one side is either less than or greater than the other. It can also state that we have a good idea but are not exactly certain the differences in value. This is displayed by using the greater than or equal to and less than or equal to values. They can also just not be equal to each other. When these values are expressed in a standard numeric inequality they can be read and understood. When we want to visualize this for ourselves or others to better communicate the notion, we use a number line to help explain the range of where the possible solution could be found. This will become much more helpful when you are beginning to consider the possibilities of compound inequalities. Which is composed of two or more statements. Visuals, in this case, are not only helpful but necessary to help understand possible solutions.