Making Pictographs Worksheets
What Are Pictographs? Just like sometimes we use pictures to describe objects, we use graphs and charts to display statics in some mathematical questions. One such type of graph is known as Pictographs. Pictographs are a representation of data through images. These graphs are used in statistics to represent the frequency of data. Pictures and symbols that are relevant to the data are also used. Pictograms are the simplest, and the easiest representations of statistical data. Every image in the graph represents a certain number of things. Pictographs are mostly used in writing and graphic systems where the characters can be displayed through a picture. Pictograms are often used in various other subjects such as geography, leisure, and tourism. Pictograms are really pretty to look at! They provide you with the information you need, and they help you understand data quite easily! Students can use these worksheets and lessons to learn how to make pictographs and be able to understand them.
Aligned Standard: 2.MD.D.10
- Robin's Book Store Step-by-Step Lesson- Take a look at robin's book sales over six month's and answer some questions about them.
- Guided Lesson - An international survey, arranging a picture graph, and finally putting it all together.
- Guided Lesson Explanation - I really nailed the second and third one, but the first one might be a little lax on explanation.
- Practice Worksheet - Ten problems that are sure to keep you busy.
- Matching Worksheet - It took me forever to figure out how to set this up. I'll add more sheets to go with it soon.
- Answer Keys - These are for all the unlocked materials above.
Homework Sheets
The homework provides a solid lesson each time to get them started.
- Homework 1 - Alan has a bag store. This year he looked deeper into his sales. He sold the following number of bags over the months.
- Homework 2 - There is an international survey report on the number of girls and boys born with a particular disability during the year 2012.
- Homework 3 - We have three types of vehicles (car, motor bike, bicycle). We will need to create a separate column for each type of vehicle.
Practice Worksheets
I really tried to scatter the questions up here for them and not let them get comfortable with the topic, since it can go in so many directions.
- Practice 1 - Sunny sells cricket balls at his shop. He tracked his sales so far this year. He sold the following number of cricket balls over the last 6 months.
- Practice 2 - Arrange the pictures given below to create a pictograph.
- Practice 3 - Roy drinks cola at the market. The shopkeeper tracked the number of bottles he drank this month.
Math Skill Quizzes
You should find a really good mix of question types here.
- Quiz 1 - There are ___ lunch boxes than bags.
- Quiz 2 - Robert has a candy shop. This year he looked deeper into his sales. He sold the following amount of candy over the last 6 months.
- Quiz 3 - Albert is a bus conductor. This week he looked deeper into his collection.
How to Make a Pictograph
We will make a pictograph to display the numbers of cheeseburgers that were eaten by a group of friends over the course of a week.
Step 1: Data Collection - Since this is a tool that we use to display data, we first must collect the data. You can do this by using a tally chart, since the number of cheeseburgers should not be that high. We would approach each friend and ask him the number of cheeseburgers he or she ate over the last week. Michael ate 5. Tara ate 2. John ate 4. Sara ate 1. Jacob ate 3. Here is a summary of the data that we collected:
Michael: 5, Tara: 2, John: 4, Sara: 1, Jacob: 3
Step 2: Pick a Symbol - The symbol that choose should give the audience a clear understanding of what the data represents. In this case, it makes a lot of sense to use an image of a cheeseburger as our symbol.
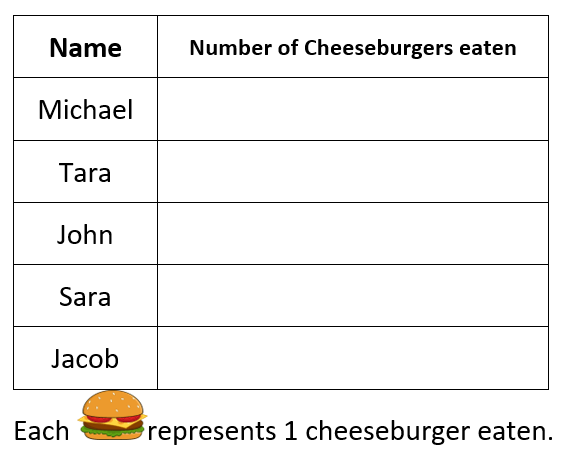
Step 3: Pictograph Outline - We will create a two-column chart. The left side will list the names of the people. The right side will indicate the number of cheeseburgers that they ate. Each burger image indicates 1 cheeseburger eaten. It is important to label that somewhere near the chart. With this in mind, here is what our outline should look like:
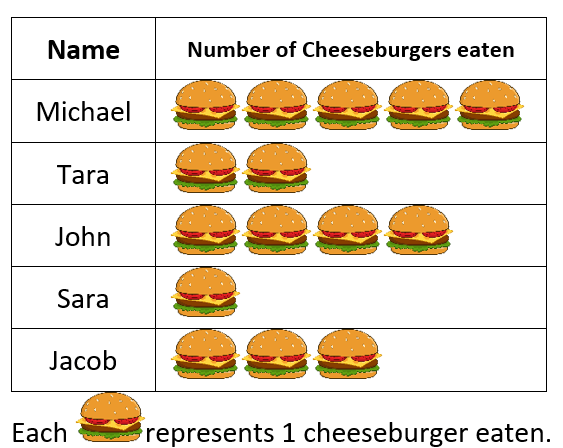
Step 4: Plot Data - We now place an image, in the column to the right, for each cheeseburger eaten by each of the people. Based on our original survey, which was: Michael: 5, Tara: 2, John: 4, Sara: 1, Jacob: 3. As you see below, these are fun and attractive charts that bring some excitement to your audience.