Graphs of Functions Worksheets
When a function is set out on a graph it is easy to spot because it does not have more than a single value for y. That is because for every input there is only one output. There are several tests that we will discuss that can help determine more about them. Depending on the type of function you are working with they will most likely have characteristic pattern that you can clearly see in the visualization. This series of worksheets and lessons has students learn to work their way around with graphs of functions. The purpose being to use them to your advantage.
Aligned Standard: HSF-BF.B.3
- Graph Changes Step-by-step Lesson- If you change the value of the y-intercept, how does it change the graph of the function?
- Guided Lesson - It is really neat to work this through with kids on a graphing calculator, so they can instantly see the difference.
- Guided Lesson Explanation - I use to have kids make moving line flip books to illustrate this. It's a fun activity!
- Practice Worksheet - A true mix of changes that students must evaluate at every corner.
- Matching Worksheet - Looking back, I did truly over explain some of these.
- Answer Keys - These are for all the unlocked materials above.
Homework Sheets
There are a great number of variables to digest here with these problems.
- Homework 1 - Using the function y = 2x + 5, which statement best describes the effect of increasing the y-intercept by 5?
- Homework 2 - Both lines are parallel, so the slope is the same. No, the lines does not touch the origin (0,0).
- Homework 3 - Rewrite the equation with the double of slope and leave the y intercept the same.
Practice Worksheets
Understanding the value and trends of the slope of the line are truly key here.
- Practice 1 - Which is it? : a. The new line is parallel to the original. b. The new line has greater rate of change.
- Practice 2 - Which best represents this line if the slope is doubled and the y-intercept remains constant?
- Practice 3 - Step by step answers for you.
Math Skill Quizzes
When do these lines pass through the origin?
- Quiz 1 - The graph of a line that contains the points (-1, -6) and (4, 9) is shown below.
- Quiz 2 - Which statement best describes the effect on the graph of f(x) = 6x - 2. If the y intercept is changed to + 1?
- Quiz 3 - Using the function y = 6x + 2, which statement best describes the effect of increasing the yintercept by 3?
How to Tell If a Graph Represents a Function
If you see a graph or create one and want to understand if it is a function, we run it through the vertical line test. If we remember that a function can only have one output for every input, it stands to reason that it can only have a single y value for every x we have. To see if this holds true draw a vertical line (up and down) to see if you cross a line twice. If you do, it is not a function. If the vertical line does not intersect the curve more than once, it is a function.
What Do Graphs of Functions Look Like?
A pattern is anything that repeats itself, i.e., a particular action taking place again and again at regular intervals. In this way, a straight line is a pattern where all the points that are connected with each other are formed on the same plane. Suppose you have an equation to graph x + y = 7. The equation means that when the two variables are added, you get 7. They can 1 and 6, 5 and 2, 4 and 3 or 7 and 0. Given that we put these numbers in the form of a table and start plotting them accordingly, we will get a pattern that will be represented in the form of a straight line. When placed on a graph, the pattern is evident as when we join all the points, it forms a straight line.
You can see to the right that we displayed the graphs of the more common functions for you reference.
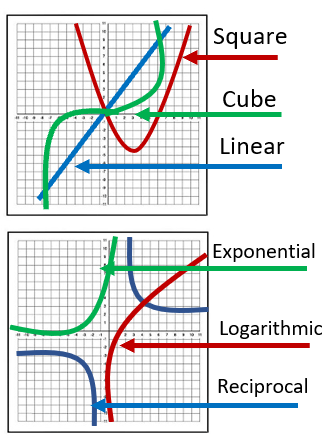
Linear- Linear functions as the name implies result in a line and follow in the format of f(x) = mx + b.
Square- These are classified as even functions and resemble a parabola. They follow the format of f(x) = x2.
Cube- These are classified as odd functions that flatten out at the origin (0,0). They exhibit a symmetry across that origin. They follow the format of f(x) = x3.
Exponential- They follow the format of f(x) = nx, where n is a number greater than 0. These graphs hug the x-axis and then rise across the y-axis quickly. If n is between 0 and 1 the line starts on the right kicks to the left. If n is greater than 1 it follows the example and starts on the left and rises quickly to the right.
Logarithmic- They follow the format of f(x) = logn(x), where n is a number greater than 0, but not 1. Since logarithms are the inverse of exponential functions it stands to reason that these follow much the properties and paths as we just discussed.
Reciprocal- These guys are composed of two branches, which differs a lot from the other graphs and makes them stick out like a sore thumb. The shape can be described as a hyperbola, and it is an odd function. They follow the format f(x) = 1/n.