Graphing Linear Inequalities Worksheets
Linear inequalities are just comparisons of two linear expressions. We are accustomed to comparing values with the greater than or less than symbols, but inequalities lack a true value and are rather helpful for making mathematical generalizations. Because of this they use a different symbol that indicates that it could greater or lesser than, but also equal. When we graph linear equalities, it is fun because not only do we plot the line of the equation, but we also indicate where else (greater or lesser) the answer could possibly be. Graphing linear equalities is very helpful to represent a relationship that may exist between a rate of change. These types of graphs are often used to describe the constraints of materials or products. Such as what temperature they should be used in. These worksheets and lessons help students make plots of linear inequalities in a half plane setting.
Aligned Standard: HSA-REI.D.12
- Y-Intercept Step-by-step Lesson- This one comes down to shading and that's about the sum of it all.
- Guided Lesson - We make the equations a bit more difficult to point there graph right away.
- Guided Lesson Explanation - As you see, you will need plenty of graph paper.
- Practice Worksheet - We give you pretty standard inequalities to work with. The standard does call for a bit more. You will see new sheets soon to address this.
- Matching Worksheet - Match the inequality to the correct graph. Pay attention to the numbers.
- Graphing Systems of Inequalities Five Pack - We ask you to solve it, but graphs help you volumes.
- Graphing Linear Inequalities Five Pack - You just need to make the graph here. Remember that the intercept gets it all started.
- Graphing Inequalities Five Pack - Yeah it's a ditto of the last pack. Obviously different problems though.
- Answer Keys - These are for all the unlocked materials above.
Homework Sheets
Hopefully the shading works out for you.
- Homework 1 - The graph of y < -5 is a horizontal line. Every y-value is -5, including the y-intercept. Start by graphing the line y = -5.
- Homework 2 - The slope-intercept form of a linear is like the slope intercept form of an equation (y = mx +b), but with an inequality symbol instead of an equals sign.
- Homework 3 - The slope-intercept form of a linear is like the same form of an equation (y = mx +b), but with an inequality symbol instead of an equals sign.
Practice Worksheets
I found that black and white copies come out better with this color scheme, I'm not sure why.
- Practice 1 - If the inequality uses the symbol ≥, so be sure to draw a solid line.
- Practice 2 - Finally, figure out which region to shade. You could remember that when inequalities start with y > or y ≥, you should shade above the line.
- Practice 3 - Graph all the inequalities below.
Math Skill Quizzes
Flat graphs, then tilted graphs, ending with more flat graphs.
- Quiz 1 - You could remember it as, if you are lesser than something, the shade is below you. If you are greater than a value, the shade is above you.
- Quiz 2 - Finally, figure out which region to shade. You could remember that when inequalities start with y > or y ≥ , you should shade above the line.
- Quiz 3 - Graph this inequality completely with shading: y < 5
How to Graph Linear Inequalities
By now you must have understood the importance of graphing equations. Linear equalities or linear inequalities, both types can be plotted on a graph. But plotting graphs of these mathematical entities requires that we have the ability to comprehend what they mean, when we do. So, to start with the basics, let's learn what they are first. Linear Inequalities also entails a linear function while being an inequality. A linear inequality is simply a comparison of two linear expressions. Since these expressions are not precise, neither is our comparison and it results in the use of a non-exact comparison symbol. So, our final answer is not precise, but we have a general understanding of where it is located on a graph.
To appropriately graph a linear inequality, plot the "equals" line on the graph first, then shade in the correct area. Make sure to rearrange the equation, leaving the y-variable on the left and everything else on the right side of the equation. Now consider plotting 'y =' line; make it a definite line for y ≤ or y ≥, and a dashed line for y< or y>. Now color or shade above the line for representing a "greater than" (y > or y ≥) or below the line for a "less than" (y< or y ≤).
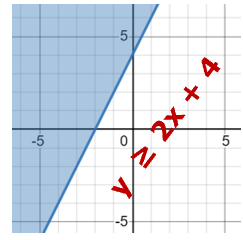
You can see how we have plotted the linear inequality y ≥ 2x + 4. We plot it as y = 2x + 4 and draw the line. I find it helpful to just choose random values for x and then plot all the points to find the line. Once the line is connected all that is left to do is shade the greater than (≥) region, which is above the line. This indicates that our solution resides somewhere on or above the line.
The overall process is very similar to plotting the equation of a line on a graph. We just need to go one step further and tell where the possible solution is by shading one side or another of the line.
Why Do We Graph Linear Inequalities at All?
In many cases this skill is presented to students in a matter of fact manner. Truly understanding why this skill matters helps students understand where and when to apply it. When you perform this skill you will treat it like any other linear function that you place on a coordinate system. The difference is that you are just not plotting out a line but shading an area from the line that satisfies the inequality. What that means is that we are entirely sure where the answer lies in the coordinate system, but we are certain where it could be. Think of it like a search map that you see in all those cheesy action movies. We know that the suspect will be found in the area. That is the same thing as the solution to our inequality, we know that the answer lies in here. While this is not an exact science it is very helpful in narrowing down where the solution lies. When you begin to work on more complex projects you will see situations where you have multiple related inequalities. When you put several of these solutions together you can begin to pattern emerge that really tightens down your final answer.