Visual Conversions Between Fractions, Decimals, and Percents Worksheets
Using visuals to explain a value is an important concept that many different students should use to really help themselves understand the nature of these values. The man thing that we hope to impart on students is that regardless which of these formats that you choose to display a value in, the overall value is still the same only the format is changed. These worksheets and lessons will help students better under the meaning of a decimal, fractional, and percentage value through the use of images.
Aligned Standard: 4.NF.B4.b
- Step By Step Lesson- Talk about that shaded area and describe it.
- Guided Lesson - Some really unique questions can be found here.
- Guided Lesson Explanation - It all about picking it apart slowly and methodically.
- Worksheet 1 - You are given a visual shape with section colored in and not so.
- Worksheet 2 - Tell us the fractional, decimal, and percentage value of each.
- Answer Keys - These are for all the unlocked materials above.
Homework Sheets
After two of these sheets, you should be good to go.
- Homework 1 - Tell what part of each of the following pictures is shaded in terms of fraction, decimal and percent.
- Homework 2 - Round the answer, you determine, to the nearest hundredth.
- Homework 3 - Always start by determining the total number of boxes in the figure.
Practice Worksheets
I would always try to start by formulating a fraction first.
- Practice 1 - The second step is always to determine the total number of shaded boxes in the figure.
- Practice 2 - You can determine the fraction of shaded area by dividing the shaded are by the total number of boxes.
- Practice 3 - To convert the decimal value to a percentage just multiply it by one hundred.
Math Skill Quizzes
Your first task is to count the rows and columns, you can also reduce the fraction.
- Quiz 1 - See if you can complete these in three or less steps.
- Quiz 2 - Take your time with this one.
How to Use Boxes to Model Fractions, Decimals, or Percentages

Boxes can be a great way to learn different concepts in the field of mathematics. You may remember how we used boxes to model the decimal form of numbers. They make an easily recognizable set of units and can be ordered in a number of different ways. We also used the 1s, 10s, and 100s boxes when we previously learned the concept of place value. Understanding how each series of the structures is arranged essential. It starts with understanding the total number of boxes in the series and those that are full or complete. Let's take a look at how we can use boxes to emulate the values in fractional, decimal, or percentage form.
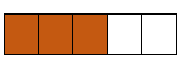
Fractions - Fractions are the fundamental view that we will ground ourselves with when modelling values in these different formats. Fractions follow the suit of: numerator divided by denominator. The numerator is the number of parts you possess, and the denominator is the number of parts that are found in a whole unit. When we translate this to visualizing it with a series of square, the numerator would indicate the number of fully colored shapes and the denominator would indicate the number of shapes that are found in a series.
Let's visualize the scenario: Natasha ate 5 pieces of chicken out a 10-piece Kentucky Fried Chicken bucket. This would mean that we would draw 10 boxes to indicate the number of total pieces in the bucket. Then we would color in 5 of those boxes to indicate the number of pieces that Natasha ate.
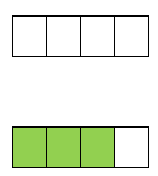
Decimals - For understanding decimal numbers, let's take an example of 0.75 and visualize it. The easiest way to work on this is to convert that value to a fraction first. This value is to the hundredths place, so we can just place it over 100: 75/100. This value can be reduced to 3/4. To visualize this, we first note the denominator (4) with the number of needed boxes. We then color 3 of the 4 of them to indicate the value of the numerator (3).
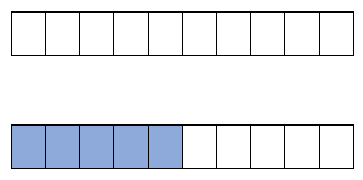
Percentages - The best way to visualize a percentage is to start off on fractional form once again. For example if we wanted to visualize 60%, the best way would be to first convert it to a fraction. 60% = 60/100 or 3/5. We could visualize it with 100 boxes, but that may be too cumbersome, so we will plot the reduce value once again which is a total of 5 squares (denominator), with 3 that have been colored (numerator).