Scatter Plots and Trend Line Worksheets
Graphs are visual representations of information and data. You may often see graphs in business presentations and infographics. They summarize information by arranging data visually and creating a visual representation from charts. Demographics, price points, and other information are used to create these visualizations. Plots are not just used in math; they are also used in several other math-related subjects. Algebra, geometry, topology, and trigonometry all use plots in operations. A plot is a graph that a new or old point generates relative to an existing line. Data entry is typically represented as a point with a position, a scale, and many X-Y coordinates. This means whenever we have a scatter plot, we have a structure where we can see the data represented graphically. Scatter plots are a way of representing data by graphing two sets of data on the same picture. The two data sets are graphed against each other, and the resulting data points are sometimes grouped or shown as a trend line that connects all the data points. If we are able to make sense of the prevailing direction of the data, we can create a trend line which can help us explain a relationship that exists within the data. This is a series of worksheets that helps students learn to identify and interpret scatter plots of linear functions to see what relationships may exist and what we can learn from them.
Aligned Standard: HSS-ID.B.6c
- Trend Line Equations Step-by-step Lesson- Where the previous standard had us understand the trend line, now we find the equation for it.
- Guided Lesson - I'm trying to be positive here! See if you get what I mean. That should be an extra credit question.
- Guided Lesson Explanation - This is a bit lengthy four page explanation of the problems for you.
- Practice Worksheet - Yes, these trends are a bit on the side of all over the place.
- Matching Worksheet - Match the graphs and their trend line equations.
- Answer Keys - These are for all the unlocked materials above.
Homework Sheets
Time to mathematically breakdown the trends on lines.
- Homework 1 - A trend line roughly describes the relationship between two variables in a set of data.
- Homework 2 - Plug (1, 2) and (0, -6) into the slope formula.
- Homework 3 - Plug the slope m = 3 and the y-intercept b = -4 into the slope-intercept formula. y = 3x - 4.
Practice Worksheets
With the basic trend plotted for you, it is pretty is to make conclusions here.
- Practice 1 - What is the equation of the trend line shown?
- Practice 2 - We can use a trend line to make predictions from a scatter plot.
- Practice 3 - It is change in y-values divided by the change in x-values.
Math Skill Quizzes
Describe the trends you see of the lines.
- Quiz 1 - Can you smell the trend that exists here?
- Quiz 2 - The top heavy lines may confuse some.
- Quiz 3 - I like to ask students to evaluate the lines by answer if we are in better or worse state from where the line starts (being the far left of the graph).
What Is a Scatter Plot?
A scatter plot is a chart that displays multiple sets of data (typically 2 or 3 sets) in horizontal bars. It shows how a particular variable (or variables) changes over time. The bars are arranged to show the time for collecting the data. As the data in these plots are scattered, these plots are named as scatter plots. They are sometimes referred to as scatter grams, scatter charts, or even scatter graphs. They use cartesian coordinates to represent the data, and the concept is to determine the correlation between two quantities. A linear correlation will make a straight line with the given set of data whereas, a non-linear depicts a curve or any other shape through these data sets. A weak correlation refers to the plot where data points are far apart, whereas a strong correlation means the data points are near. Positive correlations represent that both variables x and y variate directly, meaning values of both x and y are increasing. On the other hand, negative correlation refers to the quantities varying in an indirect proportion (values of x are increasing and y are decreasing).
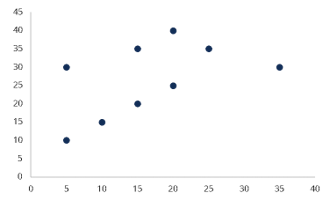
Here, sampled data has been collected to check if it can represent the relationship between two quantities. The above scatter plot has depicted the height and diameter of a collection of fictional trees. In this plot, each point represents the vertical position of a tree in terms of height (measured in meters) and the horizontal position in terms of diameter (measured in centimeters). It has been observed that the above plot shows a positive correlation as both the quantities on the x and y-axis are increasing.
What are Scatter Plots Used For?
A scatter plot uses dots to represent the values of two numeric variables in a plot with a horizontal and a vertical axis. The purpose of these plots is to identify the relationship between numeric variables. Not only does a scatter plot report the value of individual points of data, but even helps in reporting the trends and patterns in a data set.
Scatter plots can be used to identify correlational relationships. It helps in predicting the effect on one variable when we make changes to the other variable. We can use the scatter plots to determine if a relationship between two numeric variables is positive, negative, strong, weak, linear, or non-linear.
We can use the scatter plots to determine how close the points in the data set lie and if they can be broken into groups. It helps in identifying any gaps, missed values, or outlier points in the data set.
A scatter plot can be used to determine the relationship or correlation between two quantities which normally come in the form of experimental data. When an independent variable has more than one value corresponding to its dependent variable, an example of that can be a relation between the weight and height of a group of people as there can be many people of the same height with different weights. This visualization helps us to understand the connection between these variables. It also helps us spot situations where variables variate simultaneously. This is not commonly, but very helpful when we need it.
When To Avoid Using Them
A scatter plot should be avoided when the data is unrelated, which means you can't compare two quantities like a person's weight and the number of electronic gadgets in the house. The two quantities are not related, so their graph is not possible. Another case in which you must avoid a scatter plot is when you have a large set of data. This can result in overplotting, and you won't be able to conclude the relationship between the two quantities.
Points to Consider When using Them
If your plot depicts a positive or negative correlation, it does not always mean that one quantity changes in proportion to the other quantity. It might sometimes be true that the independent variable will cause some effect. To understand this, let us consider an example of sales of ice cream bars during winter. There's a common thought that people do not eat ice cream during winters which is why there are not many sales during the winter season. While it may be true, there can be other factors that might have affected the business, including the opening of a new ice cream bar in the same area. Just because there's somehow a connection does not mean that it works every time.
A Scatter plot can be used when there is more than one dependent variable. Suppose there are two dependent variables, then you can assign different colors that differentiate the two and plot the two separately against the independent variable to understand their relation. This can also help avoid the problem of overplotting.