Outliers In Data Sets Worksheets
Outliers are a type of data set with a number of unusual or unexpected values. Outliers can also be depicted visually in a scatterplot. The most likely outcomes will be found on the line if figures are normally distributed, with each data point identical to the next. But outliers exist at both ends of the scale. In statistics, they have been defined as an observation that is more than three standard deviations from its mean. These outliers are referred to as "extreme events" when analyzing large amounts of information. In essence, outliers are the highest or lowest values found in set of information. These worksheets and lessons help students learn to identify outliers in sets of data by using a variety of methods.
Aligned Standard: HSS-ID.A.3
- Finding Outliers Step-by-step Lesson- We look at the average when the extreme is removed.
- Guided Lesson - We start to grasp the reason that this skill can help you.
- Guided Lesson Explanation - You can quickly see that you can generalize from data that more representative of the average.
- Practice Worksheet - Some problems work off of the given table. Others come with their own information set.
- Matching Worksheet - These don't seem like the same types of problems at first, but you should see it by number 3.
- Answer Keys - These are for all the unlocked materials above.
Homework Sheets
Let's see how much those outliers messed up our wonderful averages.
- Homework 1 - The following table displays the sales of different brands of televisions.
- Homework 2 - An outlier is a piece data that is drastically higher or lower than all the other values.
- Homework 3 - 35 students scored an average 75 out of 110 points on the English test. 5 students scored extremely high. When these 5 students were excluded, the average was reduced to 71 out of 110.
Practice Worksheets
Some really interesting scenarios can be found in these sheets.
- Practice 1 - 55 students scored an average of 85 out of 150 on the History test. 5 students scored extremely high points. When these 5 students were excluded the average was reduced to 80 out of 150. What is the mean of the 5 outliers?
- Practice 2 - If the score of the outlier is not included, what is the mean score?
- Practice 3 - Ms. Sonia has 75 students in her class. In a graded evaluation the students averaged 65%. Due to a calculation mistake, she thought the students had averaged 66%. The calculation mistake was that 5 students who scored low points were excluded.
Math Skill Quizzes
If your students do well on these, they should have no problem. 2 problems on each quiz are deemed "difficult", by national standards.
- Quiz 1 - 60 students scored an average of 65 out of 150 on the Painting test. 5 students scored extremely high points. When these 5 students were excluded the average was reduced to 60 out of 150. What is the mean of the 5 outliers?
- Quiz 2 - The following table displays the soft drink sales.
- Quiz 3 - If the score of the outlier is not included, what is the mean score?
How to Spot Outliers in Data Sets
In probability and statistics, a data set is one of the multiple observations or measurements that a researcher could gather to help make a claim. Data sets are grouped together and analyzed when concluding a study or poll. They help make standardized information easier to analyze and compare amongst different people.
Data sets are sets of samples that together make up a population. The process of collecting data is called statistical inference, and the techniques are called statistical tests. A data set consists of all the information recorded when doing statistical analysis. The data in each group is related to some variable; it can be as small as one person, as large as a nation, or as microscopic as a single cell.
If we look at a setting outside the mathematics, we will find outliers everywhere. In mathematical terms, an outlier refers to an observation, that lies at an abnormal distance from the other values in a random sample taken from a population. In simpler terms, it can be defined as an observation point that lies away from the other observations. It is the examination of the unusual data points for that are removed from the mass of statistics.
In order to spot an outlier, what you have to do is study and analyze the data thoroughly. Look for the unusual from the mass of compiled figures. If you see any observation or number lying outside the range, data set or defined limit, know that it's an outlier. But in case of large amount of statistics, a peak into the data is not enough. Think about a data set having 500 columns and 10K+ rows, would you still be able to find out the outliers in just a peak?
For cases such as these, there are a plenty of methods in statistics to find out these outliers. Some of these methods are complicated while others are not, however both are effective.
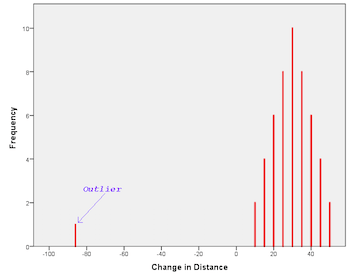
For example, if a data set has recording sales numbers, last month's sales numbers may be an outlier. Moreover, outliers can be problematic as they jump out of context, we can't predict how to interpret them. Let's see an example through a graph. The picture is a histogram depicting the change in the distance against frequency. When you look at this graph, you'll notice that there's one value on the extreme left corner of all the points. This point is known as an outlier.
Outliers don't always occur by accident. They represent a point that, for whatever reason, was originally left out of the statistics. The causes of outliers vary depending on the data set itself. The common causes may include:
- Mistakes in entering a key stroke, Human Error
- Errors during measurements, Instrumental Error
- Deliberate (to verify the precision of detection methods)
- Errors in sampling, collecting, or combining information from unauthorized resources.
- Errors during experiments, mostly planning or execution
- Errors in processing figures, tampering with collected values
To identify an outlier in a given data set. It has to satisfy one of the two equations:
1. Outlier < Q1 - 1.5 (IQR)
2. Outlier > Q3 + 1.5 (IQR)
To find an outlier, you first need to compute Q1 (First Quartile), Q3 (Third Quartile), and IQR (Inter Quartile Range). As mentioned above, outliers are extreme points, meaning they can be higher, lower, or both outliers in a data set.
For Example, consider a data set 9, 0, 35, 2, 5, 12, 6. Find an outlier, if any.
Solution: The first step is to arrange your data set in the ascending order (smaller value to bigger value):
0, 2, 5, 6, 9, 12, 35 (ascending order)
The next step is to find the minimum and maximum values from the given values.
Minimum Value (min) = 0 and Maximum Value (max) = 35
Moving on, the next step involves finding the median or Second Quartile (Q2). The median is the mid-point of your data set. Since we have an odd data set, there will be only one median. Here, the median (Q2) is 6 (fourth element) as it divides the data into three elements on the left and right sides.
Now, we have to find the first and third quartile. To do so, divide your data set into two halves with a mid-point: (0,2,5) 6 (9,12,35). The first three elements will be used to find Q1 and the last three for Q3. Moreover, the mid-point of these pairs will define Q1 and Q3. As a result, Q1 = 2 and Q3 = 12.
Lastly, we need to find IQR, the difference between the first and third quartile. IQR will be calculated in the following way:
IQR = Q3 - Q1
IQR = 12 - 2 = 10
Now, we must look at the two conditions to see if there are any outliers.
Condition 1: Q1 - 1.5(IQR) = 2 - 1.5(10) = -13
Condition 2: Q3 + 1.5(IQR) = 12 + 1.5(10) = 27
The result shows that there is no element less than -13 in the given set of data, which means there is no lower outlier. However, 27 is greater than 35, which means 35 is a higher outlier.
The most important thing you can do with your data is identify outliers; those numbers that seem not to fit with the rest of your data. They can help us find the bottom of the bell curve. You might have an outlier for sales or cost per lead. There are different ways to identify outliers. Here are some of the methods used to find an outlier:
- Modeling (Statistical and Probabilistic)
- Models of Information Theory
- Extreme Value Analysis (Z-score)
- Models of Linear Regression
- Models based on Proximity
- Box Plot Method
- Outlier Detection Methods for High Dimensional Data
Outliers are data values that are unlike the majority of the data set. These values are more than just an exception; they stand apart from the rest of the values. Outliers are often thought to be highly influential.
For instance, outliers might be the result of a few companies that are vastly ahead of the group and stand out from the pack. Outliers might not result from a goal that all other companies in the samples try to achieve. The outliers can also be products or services that are especially difficult to enter or exit, or they might be strategies or even companies that are much larger than the rest of the companies in the sample.
Outliers should be studied thoroughly. They sometimes provide useful information regarding the process or the data collection. Before assessing whether or not these points should be removed from the data, it's important to understand why they emerged.