Standard and Absolute Deviation Worksheets
To better understand the nature of a data set these are two measures that we commonly use. Absolute deviations are a way of visualizing the spread of the bell-shaped curve and the confidence with which you can describe the outcome. Moreover, standard deviation calculates squared differences and is always equal to or greater than the mean absolute deviation. Standard deviation is preferred when the data points are of normal distribution. On the other hand, in the case of extreme outliers, the standard form will be much higher when compared to absolute form. These worksheets and lessons help students understand the meaning and how to calculate standard and absolute deviations from data sets.
Aligned Standard: HSS-ID.A.2
- MAD Step-by-step Lesson- I made sure to give you a very light data set and baby step you through the process.
- Guided Lesson - We throw some units of measure in there and ask for the standard, variance, and mean.
- Guided Lesson Explanation - We walk through all the different formulas here.
- Practice Worksheet - Time to pound away at some data sets.
- Matching Worksheet - In this we round to the nearest thousandths, although the significant figures only dictate two digits.
- Answer Keys - These are for all the unlocked materials above.
Homework Sheets
Two sheets on mean form and a final sheet on standard form.
- Homework 1 - First add all of the numbers in the data set together. Then divide by the total number of values in the data set.
- Homework 2 - Take each number in the data set, subtract the mean and take absolute value. Then take the sum of the absolute values.
- Homework 3 - Calculate the standard and the mean absolute deviation of the following data set.
Practice Worksheets
I made sure that the data sets were very compact here so that students could focus on the process rather than the math.
- Practice 1 - In the data set below, what is the mad? 55, 68, 78, 69, 43, 50, 40
- Practice 2 - Compute the mad by dividing the sum above by the total number of values in the data set.
- Practice 3 - Compute the mean, variance, and standard deviation.
Math Skill Quizzes
The quizzes follow the standard 6 to 9 pieces of data that you will find on most assessments.
- Quiz 1 - Calculate the standard and the mean absolute deviation of the following data set.
- Quiz 2 - A real mix of data sets.
- Quiz 3 - Find out how to organize the data first.
What is the Difference Between Standard and Absolute Deviation?

When we hear about average, we often forget that most people see the world very differently from one another. Some people have a strong preference for being average, but others have a strong preference for being either far away or close to average.
Whether you work on a warehouse floor, roll out software, or just want to predict weight, a revolutionized view of risk using standard deviation and absolute deviation can be transformative.
The main purpose of standard deviation is to measure the amount of variation in a given population. That is, it tells you how spread out the data is. It is different from a mean or a median, which measures the middle or the average of a set of data and not the amount of variation. It can tell you the amount of variation in a data set.
For the data set of 100 observations, 40 of the total observations will be within one standard digression of the mean, 25 will be within two standard deviations of the mean, and 5 will be within three standard deviations of the mean.
The data points are often close to the average when the standard digression is low. In contrast, a higher standard deviation value shows that the data points are distributed across a vast value range. It can be viewed as a standard way of defining data between normal, large, and relatively small in a data set.
Standard deviation is the most well-known measure of how much distribution is spread out. Absolute deviation is the distance from the mean of a distribution, which you might find more helpful if you're trying to understand outliers or under/over-reacting to digressions from a central or average value.
Measuring data sets is an essential part of handling a large amount of data. There are different mathematical tools which you can use to measure data sets differently. Standard deviation and absolute deviation are one of the most used tools.
Standard deviation is the most common tool for variability. It is found by finding the mean of the data points and subtracting them from each point and square the answer. Now you need to find the average of the squared differences by the total values minus 1.
On the other hand, the absolute deviation is another measure of variability. However, it uses absolute values instead of squares. To calculate the average deviation, we subtract the mean from all data points, then we add the average absolute values of those differences.
Standard deviation can be used to create strategies for investing and to help measure the market's performance trends, However, absolute deviation uses absolute values which makes the manipulation of different data sets more complicated.
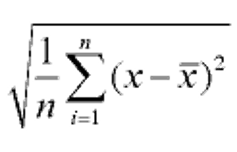
It is represented by the symbol Dx using the formula found to the left. The steps involved in the process are:
- Add the data points together and divide the sum by the number of data points to get an average or mean.
- Subtract the mean from each data point square.
- Then calculate the mean of the squared differences. To do so, add all the squared differences and divide them by the total number of data points.
- Lastly, take the square root of the mean.
This is a description of how to calculate the standard deviation of a population. If you want to calculate the sample standard deviation, divide the squared differences by n - 1 instead of n. The standard deviation is simply nothing but the square root of the variance, so it’s important to determine variance first.
An absolute deviation is the distance of a set of observations from the mean. If you have data with a measurement range and an average, you can measure an absolute deviation by finding the distance between both ends of the data and dividing it by the average. Moreover, it can be used to find the deviation of an individual data point.
It is one of the most frequently used statistical tools. The absolute deviation may help your data analytics and data science programming.
Higher values suggest that the data points are more dispersed than the mean. On the other hand, lower values refer to data points clustering closer to it. They are also known as mean absolute deviation or average deviation.
If the absolute deviation is calculated by adding up the squares of the differences between the values, the result is known as a variance. When the difference between the successive averages is squared, the result is called an average absolute deviation.
For example, if the average height of a person is 150 inches, then the absolute deviation will measure how much the height ranges away from the average height. To calculate the absolute deviation for your data set, perform a correlation test.
Formula to find average deviation is found to the left and the steps to calculate average deviation include:
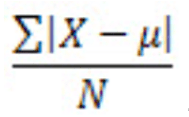
- Compute the average or mean of all the data points.
- Calculate how distant (difference) each data point is from the mean. These are called absolute values.
- Sum all the absolute values.
- Lastly, divide them by the number of data points.
The most popular measure of variability is the standard deviation, which is widely used to determine the turbulence of markets, returns on investment, and fintech. The absolute deviation is often considered as a substitute for standard deviation. Moreover, they are also used to measure the variability of investment funds and markets, though less frequently than the standard deviation.
The degree of volatility defines the possibility of risks involved. This is why investors prefer higher returns on investment from funds that generate greater volatility. Compared to a growth fund, the standard deviation of a stock index fund should be comparatively low.
The purpose of the absolute deviation is to predict when the value of a variable will change the sign. This is a much more difficult prediction than the standard deviation prediction. Absolute deviation gives you a better understanding of the variation over time.