Graphing Polynomial Functions Worksheets
Like most functions the graphs of polynomial functions have certain characteristics that we can identify from a distance. They are always smooth continuous curves with no breaks with them or corners. To be honest I always refer to them as a bad signature, because that is what they look like to me. Sense they are continuous and do not have breaks within them, they do allow us to make sense of them when we are evaluating the data that passes through them. In this section you will learn how to graph polynomial functions and describe their movement and shape. This will help you learn how to better analyze the polynomial functions that you come across. A series of worksheets and lessons that help students learn to bring polynomial functions to life on a graph.
Aligned Standard: HSF-IF.C.7c
- Three Part Question Step-by-step Lesson- Sketch the graph, find the maximum number of turns, and list all the possible zeros.
- Guided Lesson - We run the same play on some more polynomials. What is the maximum number of turns a graph of this function could make?
- Guided Lesson Explanation - I tried to give you a little outline for problems like this in the beginning.
- Practice Worksheet - Each question asks you a slightly different thing, so make sure to read it.
- Matching Worksheet - Which letter matches the problem at each turn? The way in which the questions are asked can indicate to you the possible line of answering.
- Answer Keys - These are for all the unlocked materials above.
Homework Sheets
Finding the maximum and minimums are truly the most useful skill here.
- Homework 1 - n is each to the degree of the polynomial. Polynomial functions have the maximum number of turns describe as n - 1.
- Homework 2 - Sketch a graph of this function. What is the maximum number of turns a graph of this function could make?
- Homework 3 - List all the possible real zeros. Plot the points on the graph.
Practice Worksheets
Listing all the possible real zeroes has a great application in waste treatment. I took a field trip on it.
- Practice 1 - Plop this on a graph please. This will help you make sense of them.
- Practice 2 - Find the final value of the following problem.
- Practice 3 - Use the Rational Zero Theorem to list all the real zeros.
Math Skill Quizzes
The quizzes most focuses on sketching the graphs.
- Quiz 1 - What is the maximum number of turns a graph of this function could make? State the number of real zeros.
- Quiz 2 - Sketch the graph of x2 + 3x + 8.
- Quiz 3 - Interpret and sketch these graphs. You will also be asked to state the number of real zeros that are present.
How to Graph Polynomial Functions

Suppose that you have been given data of millions of dollars of a fictional company for six years in a table. Your goal is to make sense of this data and understand the variables that contributed to this success of the company. One way to find linear paths that lead to success is to represent the data as a function. We are given this data:
Year: 1 | Profit = 52.4 , Year: 2 | Profit = 52.8 , Year: 3 | Profit = 51.2
Year: 4 | Profit = 49.5, Year: 5 | Profit = 48.6, Year: 6 | Profit = 48.6
Year: 7 | Profit = 48.7, Year: 8 | Profit = 47.1
This profit can easily be modelled by using a polynomial function:
R(t) = -0.037t4 + 1.414t3 - 19.777t2 + 118.696t - 205.332
In this case, R represents the profit generated by the company in millions and t is a representation of the years which equals 6. So over which years did the profits started decreasing or dropping? Evaluate the function to help you answer this question.
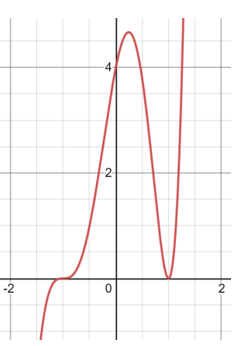
Graphs don't behave the same as an x-intercept. Sometimes a graph with cross the x-axis at an intercept. Other times it might even bounce off. Suppose that we have a graph of the function:
f (x) = (x + 4) (x - 1)2 (x + 1)3
We would treat it just like any other type of graph and choose arbitrary values for x, plug them in and determine our y coordinates. This creates a series of ordered pairs that we simply plot and connect with line. Take a look at this polynomial function when graphed to the right? Did you get those values?
Common Features of Graphs of Polynomial Functions
Polynomial functions are your standard function that have an aspect that includes a non-negative integer power of x. When we plot polynomial functions on a graph, they are constant and linear, so they always form straight lines. As the exponential portion of the functions increase in value, the lines begin to bend and form curves. These exponential portions and referred to as the degree of the function. As the degrees of the functions gets larger, those curves begin to have steeper curves. When you start to look at these graphs you will notice the concept of turning points. This is sections of the graph where the slope may drastically change upward or downward that results in a bend in the graph. When we graph these functions, we will note that they are continuous and have no breaks within them. We should also note that any real number is a valid input for these functions. We can often find the x-intercept of these functions by setting them equal to zero and solving for the possible values of x. Which makes sense because the x-intercept is exactly where x equals zero. You can also find the x-intercept by factoring. Remember if you calculate that x has several values that can be where the line curves and touches the intercept multiple times.