Reading and Making Tape Diagrams Worksheets
Tape diagrams are a tool that is used to represent a mathematical situation. This visual diagram gets its name because it looks like it represents a series of tape pieces. It is a rectangular visual model that resembles a piece of tape that is divided as per the word problem. It is also known as a divided bar model, strip diagram, fraction strip, and length model. The key here is to create identical rectangles. Each division in the rectangle will denote a new section of tape or part of the whole. As you will see below, these visuals can be used to help you solve complex problems by representing word problems in a foundational form. The worksheets and lessons in this section will help you learn to read and create your own tape diagrams for all types of different situations.
Aligned Standard: Grade 6 Proportional Relationships - 6.RP.A.3
- School Composition Step-by-step Lesson- What is the ratio of boys to girls?
- Guided Lesson - How much money did Peter go to the store with? How many runs did Rich account for?
- Guided Lesson Explanation - We test both skills here.
- Making Tape Diagrams Practice Worksheet - All these problems ask kids to make their own diagrams.
- Making and Reading Diagrams Practice 2- Remember these are used vehicles.
- Answer Keys - These are for all the unlocked materials above.
- Quiz - We fire 6 problems at you from all directions. Example: It took 4 buses to take 120 students on a field trip. How many students would be on each school bus?
- Homework 1 - This sheet is the best mix of problems in the entire set.
- Homework 2 - Painters use a ratio of 5 parts blue paint to 3 parts red paint; when mixing the purple paint for Vikings Stadium. How much blue paint would they need to make 16 gallons of purple paint?
- Practice Sheet 3 - Proportions on the length of ribbons and wooden boards.
- Practice Sheet 4 - Students vote for what they want to eat during a class party.
- Practice Sheet 5 - These questions are more focused on reading premade diagrams. You will work on problems like this: Lisa raised $45 for the animal shelter, which was 5 times as much money as Helen raised. How much money did Helen raise?
You may also see this work referred to as a Bar Model. They tend to go hand and hand. The basic premise is that we are using visual diagrams (pieces of tape or bars) to define parts of a whole.
Answers are included in these pages. Check out page 2 of each file.
What Are Tape Diagrams in Math?
Tape diagrams are mathematical graphic organizers that students can create to model many different types of real-world math situations. They use various rectangular arrays in drawing formats to recreate these situations. Each rectangle usually represents a section of a ratio. This serves as a great visual reminder of all the aspects found in a word problem. There are commonly three main uses of tape diagrams:
A) Part Whole Model - This is a quick way to display multiple items that contribute towards a whole. It almost acts like a pie or circle chart in a rectangular format. These can be used to model all of the four basic math operations (addition, subtraction, multiplication, and division). Here is a look at a tape diagram that models the types of drinks in your cooler if the values were 6 waters, 4 juices, 2 sodas:
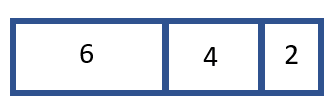
As you can see from the diagram the length of the rectangle is in sync will the size of the value. The rectangle for 6 is bigger than the rectangle for 4 or 2. We can use this to learn that there are a total of 12 drinks in the cooler. This model can also be used to make visuals of basic algebraic equation. For example, building off of what we have explored so far. If we were not told the number of waters but knew there were 12 drinks in the cooler. We could use that information to model: x + 4 + 2 = 12.
B) Addition Comparison - The model is used to help in situations of addition or subtraction. With this tape diagram we are comparing two different quantities by using those math operations. In most cases we are using two tapes with one section missing. That section represents the value we are attempting to determine. For example, let’s compare the number of waters to the number of sodas, from the previous scenario that we described.
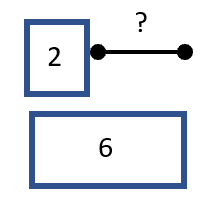
This allows us to setup a comparison using either addition or subtraction. This is a great way to begin to use algebra to model situation because this model allows us to approach these equations from both angles. We could recreate this situation by using either:
Addition: 2 + x = 6
Subtraction: 6 - x = 2
You could also use this to learn to solve those one-step problems.
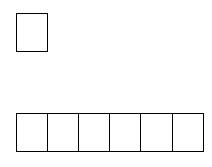
C) Ratio Models -This is used to compare multiplication or division scenarios. We use this to compare equal groups. These are helpful for any problem that uses the phrases "as many as". The ratio model below displays a 1 to 6 ratio. This indicates that for every 1 box type, you have 6 box of the other type.
Tape diagrams pivot into fraction modeling as well. We will cover those in our fraction units and continue on from here. We wanted to focus you on the use of tape diagrams with math operations, at this point.
How Tape Diagrams Help Students Progress with Higher Levels of Math
This technique of using graphic diagrams to model math problems is usually introduced to students later in the elementary grade levels. It will often make an appearance when students are exploring proportions because they lend themselves to make concrete comparisons. Some students will have a very strong affinity to this technique, and it will lead them to learn how to make adjustments to model a great deal more than simply proportions. As they begin to learn operations with fractions, they will turn back to skill and it is very helpful. When used properly this method can lead students towards thinking about problems algebraically. I have seen students consistently use this skill up through Algebra 1 and have great success staying organized when tackling tough word problems. On an occasion with my accountant, she explained my taxes using this technique. We encourage teachers through the middle level and even high school level to remind their students of the tape diagram method for solving troublesome exercises.