Table of Values Worksheets
Tables of values are used in math to explore a relationship between a series or stream of data. Table of values are commonly found in all types of experiments where we are trying to determine if a mathematical relationship is present between two or more values. These help us understand how these variables interact and to what extremes they affect one another. Many different types of phenomena have been explained using these data tools. They make it clear and easy to track differences, similarities, and changes in data values. When used properly we can explain relationships, make confident predictions, and great data driven decisions.
Aligned Standard: Grade 6 Expressions and Equations - 6.EE.A.2a
- Understanding Tables Step-by-step Lesson- What expression can you find as being true in light of the data table.
- Guided Lesson - Relate the data tables to expressions. This is really a helpful skill for geometry.
- Guided Lesson Explanation - Swap out the variables to find the missing parts of the problem.
- Practice Worksheet - This has to be the longest worksheet I have ever created. Those tables take up a lot of space.
- Matching Worksheet - This one is great for a basic introduction to the skill or a cool down.
- Answer Keys - These are for all the unlocked materials above.
Homework Sheets
These sheets are just packed to the brim with data.
- Homework 1 - Jenny has 7 marbles more than Kenny has. This table shows how the number of marbles Jenny has, j, depends on the number of marbles Kenny has, k.
- Homework 2 - There are 10 liters more water in bottle A than in bottle B.
- Homework 3 - How would you write this as an equation?
Practice Worksheets
I just couldn't get my cute little clip art to fit in on these practice sheets.
- Practice 1 - There were 50 toys in each hall and 10 toys in the corridor.
- Practice 2 - A cheese pizza is 5 centimeters smaller than a mushroom pizza.
- Practice 3 - This table shows how many muffins Lisa can cook, I, depends on the number of muffins Maria can cook, m.
Math Skill Quizzes
I'm working on adding a new format for these problems.
- Quiz 1 - There are 20 windows in each building and 5 windows in a room.
- Quiz 2 - There are four times more nickels than pennies.
- Quiz 3 - Write an equation explaining this situation.
What are Tables of Values?
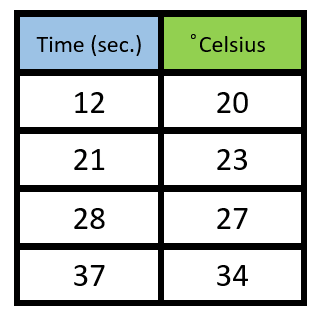
Experimenters long ago developed a standard method for charting data that consists of two variables. Those variables can represent any number of environment factor or quantifiable value. These tables allow us to see a clear and well-spaced-out stream of data. The most simplistic form of these tables consists of two columns, one for each variable. The variable the data represents is listed directly below it. Each row indicates a specific data put that was an observation or measurement of sorts. Take a look at the example table of values found at the right to represent time (in seconds) and temperature (in degrees Celsius). We can clearly see a trend in the data that temperature increases over time. We would therefore have some evidence that a relationship may exist, and it would call for further investigation, at the least.
How to Write Equations That Represent Data Tables or Charts
Mathematics is all about determining, understanding, predicting, and representing relationships. Mathematical relationships identify the impact of one variable over the other. For instance, to describe the relationship between a person's height and weight, we need to express it the form of an equation.
The most commonly used ways to represent a relationship between x and y values on a coordinate plane are using a table, a graph, or an equation. In this description, we shed light on how to represent data tables or charts in the form of equations.
A data table or chart shows a list of the values for two variables; an independent variable x, compared with the values of a dependent variable, y. To determine the relationship between these two variables, an equation can be used. Because if you know the equation, you can easily determine the answers.
Look at the table below that has values of both x and y variable. You must determine how both the costs are related and then form an equation that expresses their relationship.
(x, y), value 1 (-2, -1), value 2 (-1, 0), value 3 (0, 1), value 4 (1, 2).
Looking at the values of x and y, you can easily form a relationship between the values. It's easy to determine that each y-value is one more than the value of x. Therefore, the equation that describes this relationship is y = x + 1.