Ordered Pairs Worksheets
When it comes to the coordinate graphing system, we use ordered pairs to describe locations within the graph itself. An ordered pair is composed of a location that is described with a two-dimensional location in the format (x, y). The x coordinate tells us where the point is located in a horizontal (left-right) direction and the y coordinate tells us where the point is located in a vertical (up-down) direction. Ordered pairs can help us visual understand things like position on a map, but they are critical to assisting us in understanding the nature of algebraic expressions and equation which can be used to model systems of just about any kind. These worksheets and lessons will help make students very comfortable working with ordered pairs on a Cartesian plane.
Aligned Standard: Grade 6 Numbers - 6.NS.C.6b
- Coordinate Plots Step-by-step Lesson- Plot four points on a coordinate graphing system and tell us what quadrant that points lie in.
- Guided Lesson - More point plotting and finding points in quadrants.
- Guided Lesson Explanation - I have another lesson I'm working on that labels the quadrants, but this does its job.
- Practice Worksheet - Sorry if you find this one too small. I have to revise he grid to help you see the points clearly. A work in progress.
- Plot the Ordered Pairs Five Pack - Plot five dots on each graph. 2 graphs per page.
- Matching Worksheet - Match the points and their coordinates.
- Answer Keys - These are for all the unlocked materials above.
Homework Sheets
We start plotting points in all your favorite quadrants.
- Homework 1 - Plot the points on the coordinate plane. Label the points of the letters that are indicated for each.
- Homework 2 - What quadrant is point a located in? We show you how to figure it out.
- Homework 3 - Look for a point with a positive first coordinate and a negative second coordinate.
Practice Worksheets
Many students have success plotting their own points, but identifying points seems to trip more students up.
- Practice 1 - Four points to plot for each problem. Label the points of the letters that are indicated for each.
- Practice 2 - Another four to go. Take note of the positive and negative values to help you along.
- Practice 3 - Get it done quickly. You should be getting better each problem that you move forward with.
Math Skill Quizzes
The quadrant labeling seems to give most students some trouble at first.
- Quiz 1 - Quiz time. You really just need to focus on one of the points.
- Quiz 2 - Another go at this quiz. Make sure to read the directions for each problem.
- Quiz 3 - The end of an era. It is all about locating the correct quadrant. There are only four to remember.
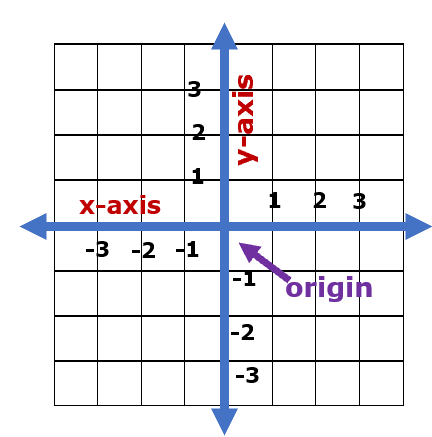
Understanding the Coordinate System
We use the coordinate plane to plot points and visually display lines. It has many different applications to the real world. It can be used to model structures and the movement in an environment. The coordinate system allows us to understand the nature of algebraic relationships. When lines are plotted in an image, it makes it easier to spot interacts than just using raw data points. We can spot trends and comprehend the trends of a system. When we plot lines and find two that intersect, we know that the equations have positions where they are the same. You can use the x and y intercepts to understand more about equations. They are listed in the order x and then y (x, y). The x values move from left to right. Just like the number line, if the value is negative it will move to the left of the 0 and if it positive, it will move to the right. The origin of the graph is where the two axes meet and it forms the foundation of the entire system. This is where all numbering begins, and it is denoted as the (0,0) position. Take a look at all these parts of a coordinate graph below:
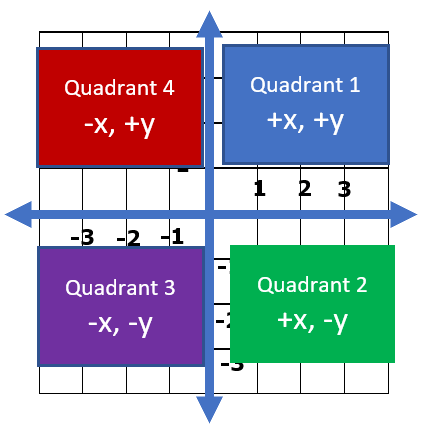
When Plotting Ordered Pairs: What does the positive and negative value of the x and y coordinate indicate?
A cartesian coordinate system can have both positive and negative values lying on the x and y-axis. The cartesian coordinate system helps in describing the algebraic relationship in a visual manner and helps create and interpret concepts of algebra.
The purpose behind the negative and positive axis and plotting dots on those planes are to indicate the location of the graph and its position with respect to the origin (0,0). These values can be used to explain a specific position in physical space like a map or an algebra expression which gives an idea where something is located. As we know the x-axis moves in a horizontal left to right manner. A negative x value is to the left of the origin and a positive value is to the right of the origin. The y-axis is similar, positive values move above the origin and negative values are locate below the origin.
Because the two axes break the system into four unique areas it often helpful to be able to different portions of the plane. We call each of those portions quadrants. The upper right quadrant is numbered 1. In a counterclockwise fashion we number the remaining quadrants 2-4. Quadrant 1 (Positive x-axis, Positive y-axis), Quadrant 2 (Negative x-axis, Positive y-axis), Quadrant 3 (Negative x-axis, Negative y-axis), Quadrant 4 (Positive x-axis, Negative y-axis). To indicate that a dot is located on the left side of the origin, it can mean that it lies either on the second or the third quadrant. We can use the concept of quadrants to explain and model position changes on a coordinate system. This is helpful to spot trends and make accurate forecasts.