Line Plots With Fractions Worksheets
There are many times when it makes sense to create visual diagrams of a data set. Especially when we are trying to make sense of the data and make an accurate prediction of what might come next. Line plots seem like a very primitive form of these visuals, but they are great for determining frequency with relative ease. Honestly in most cases they will serve as supplement visuals for your audience, but they display data that is pertinent and constantly needed. There will be many times that you will have fractional data, and this is often difficult for students to adjust to plotting, but it all comes down to labelling your number line properly. These worksheets and lessons will help students make a nice adjustment to writing fractional data on line plots.
Aligned Standard: Grade 5 Measurement and Data - 5.MD.2
- Legos and Left Overs Step-by-step Lesson- You have a pile of legos and use some to make something. What fraction of legos are left over?
- Guided Lesson - These problems are like brain teasers that actually make sense.
- Guided Lesson Explanation - It is much easier to explain these problems visually.
- Practice Worksheet - Make a line or box plot to solve all of these, it makes it much easier.
- Reading and Making Line Plots Five Pack - Breakdown the line plots and make sense of the whole thing.
- Matching Worksheet - Match the scenarios to their answers. CDs, does any one actual buy those anymore?
- Answer Keys - These are for all the unlocked materials above.
Homework Sheets
We shift focus a little on this skill and move it to containers and volume readings that directly relate here.
- Homework 1 - How much volume would the juice take up?
- Homework 2 - If David has 40 mangoes and took 1/4 of the mangoes to make juice. How many mangoes did he use?
- Homework 3 - Smith is very fond of rose juice. Rose juice consists of rose petals and water. For every serving of rose juice you need to use 30 ml of rose juice. You always match the amount of rose juice with 1/7 the amount water.
Practice Worksheets
A solid mix of problems that combine word problems, volume readings, and fractions.
- Practice 1 - James wants to buy balls. So he bought 63 balls to put in a box. How many balls would he use if he took 1/7 of all the balls to put in a box?
- Practice 2 - How much volume would the tea take up?
- Practice 3 - Suzy wants to buy bracelet. So she bought 50 beads to put in a container. How many beads would he take to put 1/5 of bracelet in the container?
Math Skill Quizzes
We worry all about the data in the quizzes to make sure that we don't lose the eye on the prize of the core skill.
- Quiz 1 - Every year Jackson goes to a garments shop. He bought 20 shirts. He arranged the shirts on a cupboard. In the first row she put 1/5 of the total shirts. How many shirts are on the first shelf?
- Quiz 2 - In a class 40 students. 1/5 students fail and the remaining passed. Find the number of passing students.
- Quiz 3 - Each pizza has 8 slices. Jorge orders 15 pizzas. There 20 people coming to his party. How many slices of pizza could each guest have if the pizza were equally distributed?
How Do Line Plots Display Data?
There are number of ways we can visualize the numeric data. Graphs, charts, and plotting on a number line are some tools that help us in displaying the numeric information visually. When we take figures and put it in a form that allows us to visually see it, this makes it much easier to see a trend that may exist and make a well thought out decision on a prediction of future statistical information.
One common and easy way to visualize the data is through line plots. A line plot is also known as a dot plot. Line plots uses a number line to visually display the numeric information. It is a way to display the frequencies of the numbers that appear in a data set. Here are the steps that you would take to create your own line plot.
Step 1 - Get Organized - The first step to display the numeric data on a number line is to arrange it. To know the frequency of each number, you can arrange the numbers in an ascending manner. Disorganized data may lead to inaccurate plotting.
Step 2 - Use a Dot or an X for Representation - The next step is to choose between a dot or a X as a way to signify a data point. You then must mark the symbol that you choose above or below the number to represent its frequency. It is customary to plot those symbols above the numbers line for each data point that is present.
Example of Creating a Line Plot
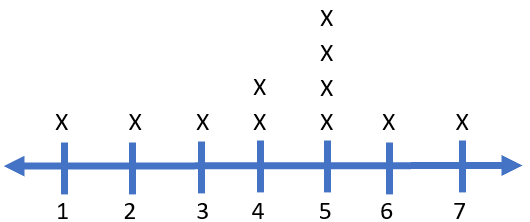
Let's say that you come across the following numeric set: 5, 4, 5, 7, 1, 4, 6, 5, 2, 5, 3.
Step 1 - Arrange the data greatest to least: 7, 6, 5, 5, 5, 5, 4, 4, 3, 2, 1.
It helps to make a quick frequency chart before you plot these. We can take that same data set and list in parathesis how many of those points you have in the set. 7 (1), 6(1), 5(4), 4(2), 3(1), 2(1), 1(1). So as we see from this quick frequency chart there will be 4- 5s and 2-4s represented on our line plot. All the remaining points will only have 1 symbol because there is only one data point to satisfy.
Step 2 - a) Create a numbers line that accommodates the range from 1 to 7.
b) Plot an "X" for each data point that exists in the set.
7 (1), 6(1), 5(4), 4(2), 3(1), 2(1), 1(1).
How Do You Display Fractions on Line Plots?
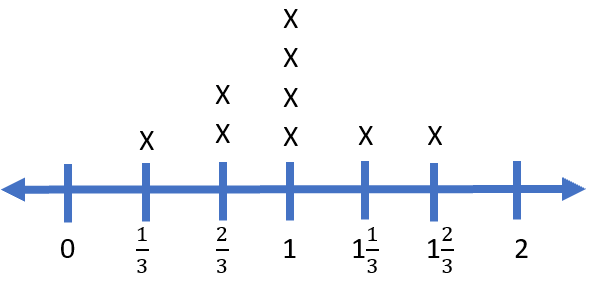
When working with fractions we would follow the same technique that we just demonstrated. The only real difference is how you label the numbers line. This will require that you break the interval into the fraction that is presented to you. For example, if we had to create a plot for the data set. ⅓ , 1, ⅔ , 1⅓ , 1, ⅔ , 1, 1⅔ , 1.
Step 1 - Arrange the figures greatest to least:
1 ⅔ , 1⅓ , 1, 1, 1, 1, ⅔ , ⅔ , ⅓ .
Create a short frequency chart for yourself from this data set:
1 ⅔ (1), 1⅓ (1), 1(4), ⅔ (2), ⅓ (1).
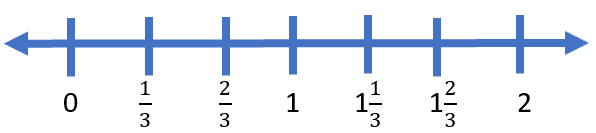
Step 2 - a) Create a numbers line that accommodates the range from 0 to 2 that is in increments of ⅓ s. You can adjust that range however you wish as long as it accommodates your largest and smallest value of the data set.
b) Plot an "X" for each data point that exists in the set.
1 ⅔ (1), 1⅓ (1), 1(4), ⅔ (2), ⅓ (1).