Probability Distribution Worksheets
What is a Probability Distribution? Probability is the likelihood of an event to happen. Probability can be used to define more than the likelihood of an event; it tells us about the possibility of all the outcomes. The thing in consideration or the thing of interest is known as the random variable. The relationship between the outcomes and probabilities of all the possible outcomes of random variables is known as the probability distribution. For example, you come up with the random sample and estimate the length of each subject. While measuring the lengths, you can draw length distribution. This distribution is important when you are figuring out which outcome is most likely, and the different likelihood of other results. This can lead you to make well informed decisions about the data that you are studying. The worksheets and lessons that are present below will give students the opportunity to better understand how to interpret and make sense of the these types of data distributions. These problems will help students learn how to discover the probabilities of all possible outcomes in an experiment.
Aligned Standard: HSS-MD.A.3
- Coin Flipping Distribution Wheel Step-by-step Lesson- I though it best to start out with only two possible outcomes.
- Guided Lesson - Counting marbles, flipping more coins, and looking at the students that are taking math.
- Guided Lesson Explanation - Sorry about the second one here. I wrote the lesson and this one weeks apart.
- Practice Worksheet - Unlike our usual ten, I only have five problem here because of the repetitive nature of the skill concept.
- Matching Worksheet - This makes for a great class closer.
- Answer Keys - These are for all the unlocked materials above.
Homework Sheets
I think that I have hit every way I have ever seen this standard put into a question here.
- Homework 1 - Mike creates a valid probability distribution for a random variable x. The chart can be seen below. Mike spilled some water on his paper and the value of P(2) is now missing. Which value would best complete the table?
- Homework 2 - In a box of 14 pens, 3 are green pens. You will be randomly selecting 2 pens. Let X be the number of green pens. Find the probability distribution of X.
- Homework 3 - Five plastic balls numbered (1, 2, 3, 4, and 5) balls are placed in a bucket. Two of the plastic balls are randomly selected from the bucket.
Practice Worksheets
I made these questions as fun as I could. The content might help them along with the work.
- Practice 1 - In a group of 18 students, 5 students are taking painting class. 3 students are randomly selected from the group. Let X be the number of students taking painting class. Find the probability distribution of X.
- Practice 2 - Two coins are flipped and let x be the random variable of the number of tails that appear. Find the probability distribution of x.
- Practice 3 - XYZ city commission a statistical study on the number of cars (x) that each family owns in their city. At the end of the study, the researchers provided the following probability distribution. What is the statistical average number of cars owned by each family in city XYZ?
Math Skill Quizzes
The most important part here is to have students identify the important variables within the problems.
- Quiz 1 - In a container of 11 cookies. 2 are chocolate cookies the rest are orange cookies. You will be randomly selecting 3 cookies from the container. Let X be the number of Chocolate cookies. Find the probability distribution of X.
- Quiz 2 - Best Buy has17 LED T.V.s. 3 of them are defective. 7 T.V.s will be randomly selected from the shop? Let X be the number of defective T.V.s. Find the probability distribution of X.
Types of Probability Distributions
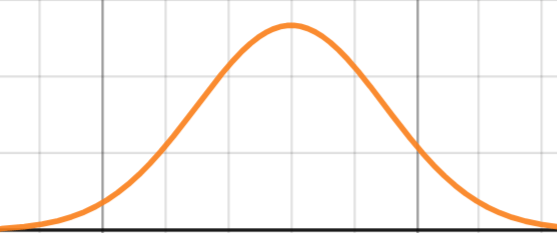
Discrete - A discrete probability function takes discrete values. Each of the discrete value assumes a specific probability of occurrence between zero and one. For instance, a coin toss that has the discrete set of probabilities, that is a head or a tail, no other value in between. These types of distributions come in three flavors: binomial, normal, and Poisson. Binomial are for situations where you only have two possible outcomes, such as flipping a coin. Normal are used for situations where central tendency and bell-like curves often used. Poisson are used to help predict the number of times something will occur in a fixed window of time.
Continuous - In continuous probability distribution, the variable can take any number between the two values. Temperatures, heights, weights are some of the examples of the continuous probability distribution. Unlike discrete probability, in the continuous probability distribution, some values assume zero probability. They are used in situations where there are equal probability for outcomes to occur, such as rolling a die. It can also be prescribed for situation where the outcomes fall within a particularly known and agreed upon range.