Two Way Tables Worksheets
Until now we have seen data tables as a simple way to organize a data set. They do not do much to help you interpret or make sense of the data. We are about to introduce you to two way tables that are a method to display bivariant data that is data that has two variables that we must accommodate. These things actual help us answer questions, when we complete them properly. We will help you begin to understand how to assess situation with the help if them. These worksheets and lessons teach students how to use two-way tables (contingency tables) to determine if relationships exist between variables.
Aligned Standard: HSS-CP.A.4
- Henkey College Step-by-step Lesson- Like at gender and full-time or part-time college student status.
- Guided Lesson - Gearing up for the next class picnic trip and taking math and physics class.
- Guided Lesson Explanation - In this one, we need to generate our own tables.
- Practice Worksheet - The first half of questions ask you to interpret tables that are already active. The last third of the questions has you generate your own tables.
- Matching Worksheet - We correlate class numbers with hand-ed-ness (if that's what you call it?)
- Answer Keys - These are for all the unlocked materials above.
Homework Sheets
We work on creating two-way tables and determine frequencies from them.
- Homework 1 - A survey was conducted for part time and full time boys and girls enrolled at school. It was found that the total number of boys enrolled was 82. From these 63 boys were full time.
- Homework 2 - What is the relative frequency of boys that play cricket?
- Homework 3 - To find the relative frequencies by row, write the ratios of each value to the total in that row. Round to the nearest hundred, if necessary.
Practice Worksheets
Start with empty tables. As you progress, they will be more complete.
- Practice 1 - It was found that 66 students own tablets and 27 students do not own tablets. There were 36 students that own mobile phones and 16 students do not own mobile phones.
- Practice 2 - What is the relative frequency of people with their favorite drink being Sprite?
- Practice 3 - A gym has 67 members out of them 25 boys are regulars and 10 boys are not regular. 20 girls are regulars and 12 are not regulars. Create a two-table to display what we know.
Math Skill Quizzes
The first one focuses on understanding two-way tables and the second has you make them.
- Quiz 1 - A group was asked their favorite football team. Use the two-way-table to answer the questions.
- Quiz 2 - 25 students were selected for football. 26 students were selected for baseball. 11students were not selected for baseball. 42 students tried out for football. Display this in a two-way table.
What are Two Way Data Tables?
The data that you use to create a bar graph is displayed using a one-way data table. It is not a common term and not many people use it to refer to a data table. However, when it comes to displaying data comprising of two categorical variables, bivariate data, the table that we use is termed as a two-way data table. These tables are very useful in everyday life as they help in analyzing survey results. The two variable names are labelled at top and left of the table and the frequency, or the count is added in the interior cells. The columns of these tables tell one trend in the data while the rows tell a different trend in the data.
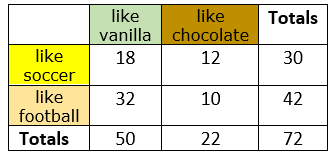
Take a look at the table we created above to display a survey of 72 people. They were asked is they preferred vanilla or chocolate ice cream. They were then asked if they preferred soccer or football. This table gives us quick answers to questions we may have about the data collected from the survey. If we want to know the answer to a single question, it is leveled exactly opposite to it. We can tell from the table that the majority of people prefer vanilla ice cream and football.
How Are These Tables Used in The Real World?
When ever you find yourself in a situation where you need to evaluate two variables in respect to one another, you will find a need for two-way tables. When marketers want to know more about what their customers feel about their products or services, they will often ask them through surveys. When they go to analyze the results, they will often break the result up by the specific demographic of the people that they asked. They can split this up using several different variables such as gender or age. This will help them spot valuable feedback that they can apply to improve their product or service and how they go about selling it. Once the two-way table is created, this is just the beginning. Understanding the data is key. When you are analyzing your results, it is helpful to calculate the conditional relative frequency to best understand the data and get valuable insights that you can take action on. We will expand on that in future topics. This is a very valuable skill to have in the real world. Those that master it often end up with stellar salaries.