Graphs of Proportional Relationships Worksheets
A proportional relationship exists between two ratios that are equivalent and vary directly with each other. There are a number of different ways that you can identify or represent these relationships based on your needs. You can use an equation form where this value is represented by a constant which normally displayed by the variable k. You can list these on a table modeling them with ordered pairs, you can also use your words and indicate this relationship exists. You can also model these values on a coordinate graph. If the straight line that is created passes through the origin then a proportional relationship is present. These worksheets and lessons with focus on using graphs to identify these relationships which is a very reliable method for uncovering these relationships.
Aligned Standard: Grade 7 Proportional Relationships - 7.RP.A.2d
- Nuts Step-by-step Lesson - Are the price of nuts proportional to the serving size?
- Guided Lesson - I give you the graph to start with on two of them, but ask you to create a graph for the second one.
- Guided Lesson Explanation - These types of problems take some time to answer properly. That is why it is spread over 3 pages.
- Practice Worksheet - I tried to have you make the graph as much as possible. You will need a lot of scrap paper.
- Matching Worksheet - Match the three tables to their constant of proportionality.
- Answer Keys - These are for all the unlocked materials above.
Homework Sheets
Use both the graph and data table to help it solidify in your mind.
- Homework 1 - Determine if the quantities are proportional. If so, what is the constant of proportionality that defines the relationship?
- Homework 2 - Kelly sold burgers over two days. Create a graph to determine if the quantities of burgers and number of days are proportional. Write an equation to describe this relationship.
- Homework 3 - Jenny eats pizza over time. The quantities are proportional.
Practice Worksheets
These problems force you to choose one approach when tackling them.
- Practice 1 - The graph below represents the number of computers sales over some days. What is the constant of proportionality?
- Practice 2 - Ashley brought packs of cookies. Create a graph to determine if the number of packs and price are proportional for each serving size listed in the table. If the quantities are proportional, write a linear equation to describe the relationship.
- Practice 3 - Justin sold book covers over four days. Write a linear equation to express this relationship.
Math Skill Quizzes
These quizzes were created with skill mastery in mind. They are a bit challenging for most.
- Quiz 1 - We tell you that these are all proportional relationships. You are tasked with identifying the constant that expresses this relationship.
- Quiz 2 - John sold magazines over four days. Create a graph to determine if there is a proportional relationship between the data.
- Quiz 3 - We explore the concept that you can make accurate predictions when you understand that the two variables are related.
How to Spot Proportional Relationships on Graphs
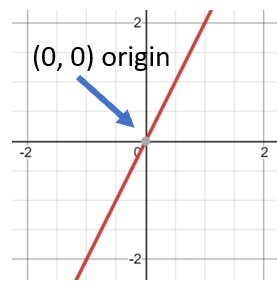
Proportional relationships tell us that two different values vary directly to one another. In an equation of a line this value is represented by the constant. When we graph these values, we can easily identify them as proportional because they will pass directly through the origin (0, 0) of the graph. When we can identify that this characteristic exists in a graph it helps us understand the nature of equation that is at work. If you can identify this quality, then there is a high level of consistency in the values. We are looking at our graphs to see that they cross that point identified in the coordinated graph below:
There is a quick way to determine if a proportional relationship exists through evaluating the ordered pairs. If you assess the ratio that exists in a (y/x) fashion and that value is consistent you have identified a constant. If that value holds for all the ordered pairs, you have identified two variables that have a proportional relationship. That ratio that you identified is called the constant of proportionality you may hear it referred to as the unit rate.