Probability Tree Diagrams Worksheets
When we are working with statistics any options that include a shortcut or method to track our progress is always helpful. A probability tree diagram is a great visual that will help you determine the probability of complex compound events occurring. These diagrams are discussed in great detail below. You will see that they consist of three key areas: branches, probabilities, and outcomes. These are all used to diagram a wide array of possible scenarios. A series of worksheets and lessons that teach students to use a variety of different methods to determine the probability of compound events.
Aligned Standard: Grade 7 Statistics - 7.SP.C.8c
- Swimming Places Step-by-step Lesson- Many the number of outcomes really gets up there when you flip a coin and pick a card.
- Guided Lesson - We add the chances of rolling a die while spinning a spinner. We also rewrite a boys name.
- Guided Lesson Explanation - We find our inner tree diagram Ying and yang to tackle these problems.
- Practice Worksheet - It seems like I am reusing the same three scenarios over and over, but only because these are the most common three questions we run into.
- Matching Worksheet - I like some of these problems. It got me thinking, does anyone buy CDs anymore? I'm hooked on my iPhone.
- Tree Diagrams Five Worksheet Pack - These are simple double or triple branch problems.
- Simple Tree Diagrams Five Worksheet Pack - These problems can be confusing. I would recommend outlining them first.
- Two-Stage Tree Diagrams Five Worksheet Pack - Everything is a double branch here.
- Answer Keys - These are for all the unlocked materials above.
Homework Sheets
I worked on mixing up the types of items that were chance.
- Homework 1 - Ava picks a card (of the 4 below) and flips a coin. How many outcomes are possible?
- Homework 2 - Anna picks a color ball and cards. How many outcomes are possible?
- Homework 3 - Grace plays a game. He rolls a die and spins the spinner below. How many outcomes are possible?
Practice Worksheets
Word to letter breakdowns are some of the most common questions we see today.
- Practice 1 - Alexander plays a game. He picks a letter from one bag and a Box from another bag. How many outcomes are possible? Draw a tree diagram.
- Practice 2 - Grace plays a game. He rolls a die and draws a card below. How many outcomes are possible?
Math Skill Quizzes
The quizzes are all in word problem form. We pull away from the pictures and ask students to visualize it for themselves.
- Quiz 1 - Lillian has a 6-sided die and 5 different balls. She wants to roll the die and take a ball. How many outcomes are possible?
- Quiz 2 - There are 4 paintings (A, B, C, D). The paintings are placed on the shelf. How many different arrangements of the paintings could be on the shelf?
- Quiz 3 - A man in a hotel ordered 2 different pastries and 2 drinks. Draw a tree diagram to represent the possible order in which he could eat them.
Anatomy of a Probability Tree Diagram
These diagrams are used to visualize the possible outcomes and their probability. They are most helpful when diagramming compound events that have a wide variety of possible outcomes. Take a look at the diagram of the probability of flipping a coin once below.
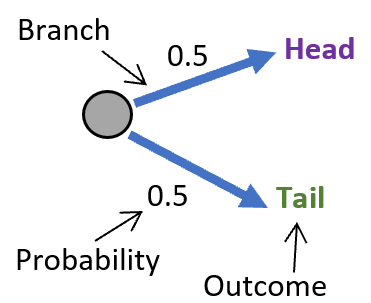
As you can see in this simple event there are three features: a) branch - this arrow extents out to indicate a possible outcome. b) probability – this is the decimal expression of probability of this event occurring. c) outcome - is the statement of possible outcome, in this case there are only two (heads or tails).
The diagram below plots out the compound probability of flipping a coin twice. You can note that it is the same chart with just another level of branches.
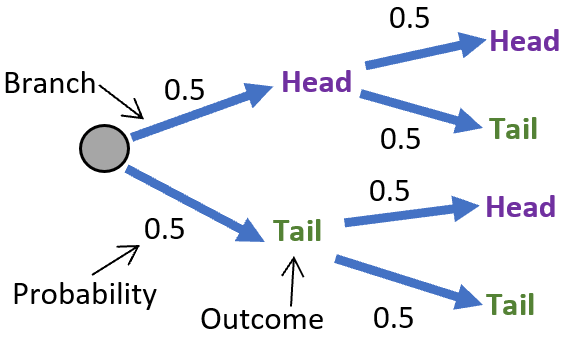
The diagram makes it easier to determine the overall probabilities of compound events occurring because all you need to do is multiply the probability of each compound event in a stream in order to determine the probability of that event occurring. For example, if you wanted to determine the probability of flipping a head (0.5) and then a tail (0.5), the math would follow as the product of each probability (0.5) (0.5) = 0.25 or 25%.
How to Generate Frequencies for Compound Events?
An event in probability is a set of possible outcomes. A simple event has a single set of possible outcomes. A simple event would be like rolling a die which could have six possible outcomes. You would have a one in six choice of landing on a choice in that case. A compound event is a series of simple events. As a result, it involves the probability of more than one outcome. An example of a compound event would be rolling a die twice and landing on a 4.
Generating frequencies is an important aspect in the field of statistics. The concept of chances is essential to learn the probabilities of compound events. There are many methods to calculate frequencies for compound events. Simulation is probably the easiest and most effective method, followed by random number tables.
You need to select a simulation method beforehand. Let us consider an example. If a baseball player makes five out of eight foul shots, then we can use a colored disk to simulate a foul shot. For instance, a blue-colored disk depicts a completed shot and a red disk could identify as a miss. Now, put five blue disks, three red disks and any other color in a container. Now mix them, and randomly select a disk to represent a foul shot. If the color of the disk you take out of the container is blue, then the batter hit the shot; if it's red, then he misses. If a different color comes out of the container, then it’s a foul shot.