Function and Chart Patterns
Being able to see trends in data and specifically spot patterns are the key to many different types of careers in analytics. These are quickly becoming high competitive career paths because of the substantial impact their analysis has on the success of very profitable businesses. While the payoff for individuals that can do this is immense so is the amount of effort that goes into preparing for the field and it all begins here. This is the ground level skill for this career path. In this section of our site students learn how to identify and complete patterns that are based in a function or data chart.
Aligned Standard: 5.OA.B.3
- Determining Math Input / Output Patterns Step-by-step Lesson- The overall goal is to find the difference and then apply it.
- Making Sense of Patterns Guided Lesson - We present you with all the different problem types here.
- Making Sense of Patterns Guided Lesson Explanation - This two pager allows you see your way all the problem types.
- Patterns In Tables Worksheet 1 - Find the rule followed by the chart pattern in each table.
- Math Patterns Independent Practice 1 - This is a different angle to see the patterns from.
- Answer Keys - These are for all the unlocked materials above.
Horizontal Input/Output Sheets
This is the format that you will see most problems for on tests.
- Homework 1 - Determine which rule best represents the expression used by the function machine.
- Homework 2 - Find the difference between the input and output values on the chart.
- Homework 3 - You can use any variable you wish to demonstrate the input. In this case we will use the variable x to display the input.
Practice Worksheets
You can shut off the all the color on these sheets by turning off "Background Printing". Just another option for you.
- Practice 2 - Circle the number sentence that best matches each function chart. Assume input is R.
- Practice 3 - Determine the difference between each input and output value.
Math Skill Quizzes
The first two quizzes are function charts and the last quiz is just a pattern rule.
- Quiz 1 - Write the difference between the input and output as a math sentence.
- Quiz 2 - Substitute in the variables and values we have found into that format.
- Quiz 3 - Determine which choice describes the rule the pattern is using.
What Are Function and Chart Patterns?
In simplest definitions, a function in mathematics relates to an output that is arrived at from specific inputs. It can be related to a machine that requires an input and provides you with output, where the output is somehow related to the input. In mathematics, y = f(x) is a function. It is a classic and age-old way of defining and writing a function in mathematics. It can be classified as a many different types of function based on the domain and range of the function. The domain is the sect of all the x-coordinates that are present and range is the same for all the y-coordinate counterparts. Other than f(x), other examples of writing functions are: x2 (squaring), x3 + 1, it is also a function. Sine, cos, and tangent are examples of functions used in geometry.
On the other hand, chart patterns are regular patterns in mathematics used to show a consistent pattern of numbers. The patterns displayed in the form of a chart are commonly known as chart patterns. They feature varying patterns of shapes, numbers and objects. The pattern can be of any mathematical operation and can be represented in a form of series. Chart patterns helps students learn counting, assist in number recognition, adding and subtracting and even discovering number patterns.
When you plot mathematical functions on a graph you will find some trends between the types of functions. Based on the type of function you are working with they will have a characteristic shape or pattern that the graph follows. We will explore the shapes of all these different types of functions.
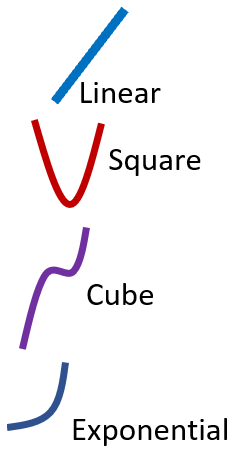
Linear Form - The name (linear) does not disappoint because they all form a straight line. The skeleton example of this form would be the equation: f(x) = mx + b.
Squares - These all have a "U" shape, from left to right they decrease and then rise again. The skeleton form of these follows as: f(x) = x2.
Cubes - These are bit tricker to spot when placed on a graph. The values begin in the negative territory while consistently rising. Then the values flatten out across the origin and rise drastically in a mirror image of itself. The skeleton form of these follows as: f(x) = x3.
Exponential Functions - These graphed lines grow very quickly. They end up looking like snowboard half pipe ramps that you will see at the Olympics. The skeleton form of these equations follows as: f(x) = ex.