Graphing Rational Functions Worksheets
A rationale function is a set of polynomials that are set in a ratio to one another. This results in having one polynomial as a numerator and the other as a denominator. When we put these little puppies on a graph, they characteristically form hyperbolas. One of the really unique characteristics of these graphs is that they have the existence of asymptote. An asymptote is a straight line that we can draw that the graph of function approaches, but never touches. They can be drawn in both vertical and horizontal directions since we are working with hyperboles. This awesome set of worksheets and lessons get students pounding through the skill of graphing functions that are rational.
Aligned Standard: HSF-IF.C.7d
- Quotient Based Function Step-by-step Lesson- Some students will really get lost with the quotient portion. Try best to guide them through that.
- Prompted Practice Sheet - I walk you though all the various phases of this problem.
- Practice Explanation - I was as visual as I could be. Many people like the way that this one came out.
- Practice Worksheet - Students will need several scrap pieces of paper for this one.
- Matching Worksheet - Match all the graphs to the functions. These are pretty memorable.
- Answer Keys - These are for all the unlocked materials above.
Homework Sheets
You need to make a graph and then diagnose the key aspects of the graph.
- Homework 1 - Find the x and y intercept and identify the Horizontal & Vertical Asymptote.
- Homework 2 - Identify the Vertical Asymptotes. Make the denominator equal to 0.
- Homework 3 - Sum up what we know already on the graph. Break these equations down to help you best understand equations at their origin.
Practice Worksheets
In these questions you are just looking for one attribute of each function.
- Practice 1 - Graph all the rational functions that are presented. You will also point out key measures throughout the series.
- Practice 2 - Identifying the Horizontal Asymptote. As the degree of numerator and denominator is same so divide the leading coefficients. 1/1=1.
- Practice 3 - The intercepts are pretty easy to find it is the others that are difficult.
Math Skill Quizzes
The main goal here is to find the position of the intercepts first.
- Quiz 1 - Way to go with the how these look when they are set out..
- Quiz 2 - Look at the exponents and see where those take you. They can tell you a great deal.
- Quiz 3 - Remember the purpose of the f(x) value. You can apply it to learn much more.
How to Graph Rational Functions?
Rational functions are a type of function that present two polynomials in a distinct ratio to one another. These functions are in the form of a fraction with both its numerator as well as the denominator are polynomials. Since it is a ratio between two polynomials, it is titled as "rational." It should also be noted that the polynomial that serves as the divisor cannot be zero or it does not receive this classification.
To graph these functions, you must determine the asymptotes, intercepts, and some points through which the graph of a rational function passes through.
Consider a rational function; y = (3x+5)/(x-1)
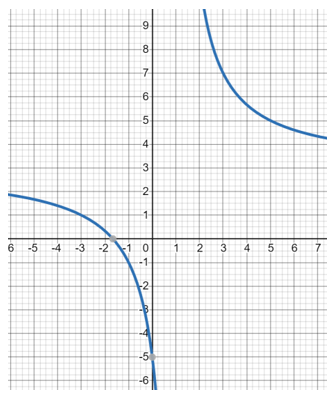
Step 1: Finding the Vertical and Horizontal Asymptotes - Asymptotes are the vertical lines where the graph does not exist. Here, if the denominator of the fraction is zero, the graph will not exist. Therefore, x – 1 = 0, x = 1 To find the horizontal, compare the highest degree in the numerator as well as the denominator. If the denominator has a degree higher than the numerator, the x-axis serves as the horizontal asymptote. If the denominator has a degree lower than the numerator, the horizontal asymptote does not exist.
If the highest degree of the numerator, as well as the denominator polynomial, is equal, the horizontal asymptote is equal to the ratio of the leading coefficient of the numerator and the leading coefficient of the denominator. As in this case, the degrees are equal; the horizontal asymptote is given by; 3.
Step 2: Finding the x- and y-intercepts - To find the x-intercept, substitute zero in place of y, and for the y-intercept, substitute zero in place of x in the function. x-intercept: (-1.6, 0), y-intercept: (0, -5)
Step 3: Finding Points on the Graph - Create a table of values containing at least three values of x and y. insert the values of x into the function to find the corresponding y values.
Plot all the values on the graph!
Why Do We Graph Functions?
When students begin to learn this skill, they often think of it as a utility or robotic like skills that serves little to no purpose. When you visualize a function, you can spot trends in the data that may flow through it. The true nature of the data that passes through it is instantly brought to life. It also helps you better analyze a series or a system. When you are able to have enough information about a function that you can actually visualize it, you should take advantage of it fully. When you see the image it can help you develop new thoughts on it.