Graphing Inverse Functions Worksheets
Have you noticed in almost all forms of mathematics that there are some operations that are the exact counter or mathematical kryptonite to one another? Addition cancel be countered by subtraction and multiplication by division. When it comes to functions the same rings true. If you have a function and want to counter its value, you would combine it with its natural inverse. Inverses are kinda the undo button for functions. If you know that f(x) created y, then if you took y and put it into the inverse of f, you would get the output of x. If you have the graph of function, the inverse of that graph is simply a mirrored reflect of itself across the origin of the graph. This selection of worksheets and lessons show students how to visualize the inverse of a function on a graph.
Aligned Standard: HSF-BF.B.4c
- Inverse Graphs Step-by-step Lesson - I walk you through two different methods. Some teachers like to use trig to solve this too.
- Guided Lesson - I give you two standing graphs that you can work off of here.
- Guided Lesson Explanation - Solve for x and then walk it through from there.
- Practice Worksheet - I made these purposely easy early on. This will help students build a little confidence. It does get more difficult as they proceed.
- Matching Worksheet - Match the graphs to the inverses of what is being presented.
- Answer Keys - These are for all the unlocked materials above.
Homework Sheets
The inverse of square roots really scare students when we start this skill. Work through a problem with them.
- Homework 1 - We look at all methods of attack as an option.
- Homework 2 - Domain: x ≥ 10/9. Start by determining standard x and y values by plugging x values into the given function.
- Homework 3 - We would follow this through all points and point the lines. The blue line would result.
Practice Worksheets
The inverse really is just the function with an adjusted orientation.
- Practice 1 - A good hint is to identify the domain of f(x).
- Practice 2 - We would follow this through all points and point the lines. The blue line would result.
- Practice 3 - f of x (f(x)) is the square root of x + 11x +12 is what we are working with here.
Math Skill Quizzes
These graphs should print well in grayscale.
- Quiz 1 - Method 1: You could first find the algebraic inverse of the function and then just plot points.
- Quiz 2 - Method 2: You could pick points for x and determine y. Then take the inverse of those points (switch the x and y values). This is the method that most people use.
- Quiz 3 - This can be done a number of ways.
How to Graph the Inverse of Functions
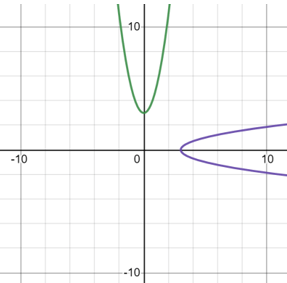
Graphing functions is very easy. In case of linear functions, you have to find the y- and x-intercept and join the line but things get tricky when we are asked to graph the inverse of functions. The inverse of any function, on graph, is just a mirror image of it reflected over the line y = x. The line that is used for a guide to reflect it over the axis passes through the origin and has a slope of 1. There are three different methods that you can use to graph these inverses. We will start with a lengthy one and introduce you to the easiest one at the end.
Method 1: Find the Inverse of a Function - When you are asked to graph the inverse of a function you can start by finding the inverse of the function. To find the inverse of a function, you replace f(x) with y and then make x the subject of the equation. Once you make x the subject, you replace x with f(x) and replace y with x. You then take a set of points and plot them on the graph. It is the most time-consuming method. This is because you need to plot a whole bunch of ordered pairs, after you first calculate them.
Method 2: A Mirror Reflection - To make things easy for you, we will disclose a secret that will save your time. When you plot a function on the graph you can easily plot its inverse without finding the inverse function. An inverse of a function is reflection of the actual function over the line y = x. It is a line that passes through the origin and has a slope of 1. You can count the squares and reflect the function over this line.
Method 3: Swapping Places of Entire Domain and Range - The easiest and the quickest method to graph an inverse of a function is to interchange the values. How? - If a function passes through the following points; (-4, -11), (-2, -7), and (0, -3), for the inverse you will have to plot the following points; (-11, -4), (-7, -2), and (-3,0).
Where Does This Apply in The Real World?
Understand how to data flows through a function is very important in many aspects of technology. Many different forms of digital communication hinge on being able to breakdown the flow of data it uses. When your wireless phone or Wi-Fi router is having communication issues engineers will trouble shoot this by sending bits of wireless packets across the channel of this device from where it originates to the device itself. Engineers can see if the packet that they initiated was distorted or changed in anyway. The calculate this by using this skill to diagnose the exact issue. Eventually they will be able to pinpoint was is jamming or changing the quality of the data stream. This skill is also very helpful, in a similar fashion, to encrypted communication. Needless to say, this is a significant application in computer security. Researchers will often be able to pinpoint vulnerabilities or errors in programming code through this technique. If you plan to work in field that involves digital communication expect to use this skill regularly.